/
MARGINAL UTILITY AND CONSUMER CHOICE MARGINAL UTILITY AND CONSUMER CHOICE

MARGINAL UTILITY AND CONSUMER CHOICE - PowerPoint Presentation

cora
cora . @cora
Follow
65 views
Uploaded On 2023-10-31

MARGINAL UTILITY AND CONSUMER CHOICE - PPT Presentation

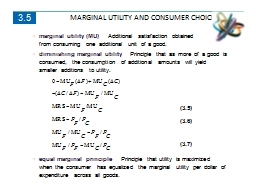
35 marginal utility MU Additional satisfaction obtained from consuming one additional unit of a good diminishing marginal utility Principle that as more of a good is consumed the consumption of additional amounts will yield smaller additions to utility ID: 1027548

living cost utility index cost living index utility year bundle ideal price base gasoline consumer current prices laspeyres point

Share:

Link:

Embed:

Download Presentation from below link

Download Presentation The PPT/PDF document "MARGINAL UTILITY AND CONSUMER CHOICE" is the property of its rightful owner. Permission is granted to download and print the materials on this web site for personal, non-commercial use only, and to display it on your personal computer provided you do not modify the materials and that you retain all copyright notices contained in the materials. By downloading content from our website, you accept the terms of this agreement.


Presentation Transcript

1. MARGINAL UTILITY AND CONSUMER CHOICE3.5● marginal utility (MU) Additional satisfaction obtained from consuming one additional unit of a good.● diminishing marginal utility Principle that as more of a good is consumed, the consumption of additional amounts will yield smaller additions to utility.● equal marginal principle Principle that utility is maximized when the consumer has equalized the marginal utility per dollar of expenditure across all goods.(3.5)(3.6)(3.7)

2. Marginal Utility and HappinessMARGINAL UTILITY AND CONSUMER CHOICE3.5A comparison of mean levels of satisfaction with life across income classes in the United States shows that happiness increases with income, but at a diminishing rate.Figure 3.20

3. Inefficiency of Gasoline RationingMARGINAL UTILITY AND CONSUMER CHOICE3.5When a good is rationed, less is available than consumers would like to buy. Consumers may be worse off. Without gasoline rationing, up to 20,000 gallons of gasoline are available for consumption (at point B).The consumer chooses point C on indifference curve U2, consuming 5000 gallons of gasoline.However, with a limit of 2000 gallons of gasoline under rationing (at point E), the consumer moves to D on the lower indifference curve U1.Figure 3.21

4. Comparing Gasoline Rationing to the Free MarketMARGINAL UTILITY AND CONSUMER CHOICE3.5If the price of gasoline in a competitive market is $2.00 per gallon and the maximum consumption of gasoline is 10,000 gallons per year, the woman is better off under rationing (which holds the price at $1.00 per gallon), since she chooses the market basket at point F, which lies below indifference curve U1 (the level of utility achieved under rationing).However, she would prefer a free market if the competitive price were $1.50 per gallon, since she would select market basket G, which lies above indifference curve U1.Figure 3.22

5. COST-OF-LIVING INDEXES3.6Ideal Cost-of-Living Index● cost-of-living index Ratio of the present cost of a typical bundle of consumer goods and services compared with the cost during a base period.● ideal cost-of-living index Cost of attaining a given level of utility at current prices relative to the cost of attaining the same utility at base-year prices.

6. COST-OF-LIVING INDEXES3.6The initial budget constraint facing Sarah in 1995 is given by line l1; her utility-maximizing combination of food and books is at point A on indifference curve U1.Rachel requires a budget sufficient to purchase the food-book consumption bundle given by point B on line l2 (and tangent to indifference curve U1).Ideal Cost-of-Living IndexTABLE 3.3 Ideal Cost-of-Living IndexPrice of books$20/book$100/bookNumber of books156Price of food$2.00/lb.$2.20/lb.Pounds of food100300Expenditure$500$12602005 (Rachel)1995 (Sarah)Cost-of-Living IndexesFigure 3.23

7. COST-OF-LIVING INDEXES3.6A price index, which represents the cost of buying bundle A at current prices relative to the cost of bundle A at base-year prices, overstates the ideal cost-of-living index.Ideal Cost-of-Living IndexTABLE 3.3 Ideal Cost-of-Living IndexPrice of books$20/book$100/bookNumber of books156Price of food$2.00/lb.$2.20/lb.Pounds of food100300Expenditure$500$12602005 (Rachel)1995 (Sarah)Cost-of-Living IndexesFigure 3.23

8. COST-OF-LIVING INDEXES3.6Laspeyres Index● Laspeyres price index Amount of money at current year prices that an individual requires to purchase a bundle of goods and services chosen in a base year divided by the cost of purchasing the same bundle at base-year prices.● Paasche index Amount of money at current-year prices that an individual requires to purchase a current bundle of goods and services divided by the cost of purchasing the same bundle in a base year.Comparing Ideal Cost-of-Living and Laspeyres Indexes The Laspeyres index overcompensates Rachel for the higher cost of living, and the Laspeyres cost-of-living index is, therefore, greater than the ideal cost-of-living index.Comparing the Laspeyres and Paasche Indexes Just as the Laspeyres index will overstate the ideal cost of living, the Paasche will understate it because it assumes that the individual will buy the current-year bundle in the base period.Paasche Index

9. COST-OF-LIVING INDEXES3.6● fixed-weight index Cost-of-living index in which the quantities of goods and services remain unchanged.● chain-weighted price index Cost-of-living index that accounts for changes in quantities of goods and services.Price Indexes in the United States: Chain WeightingA commission chaired by Stanford University professor Michael Boskin concluded that the CPI overstated inflation by approximately 1.1 percentage points—a significant amount given the relatively low rate of inflation in the United States in recent years.Approximately 0.4 percentage points of the 1.1-percentage-point bias was due to the failure of the Laspeyres price index to account for changes in the current year mix of consumption of the products in the base-year bundle.