/
A Study of Luminance Distribution Patterns and Occupant Preference in A Study of Luminance Distribution Patterns and Occupant Preference in

A Study of Luminance Distribution Patterns and Occupant Preference in - PDF document

danika-pritchard
danika-pritchard . @danika-pritchard
Follow
407 views
Uploaded On 2016-06-23

A Study of Luminance Distribution Patterns and Occupant Preference in - PPT Presentation

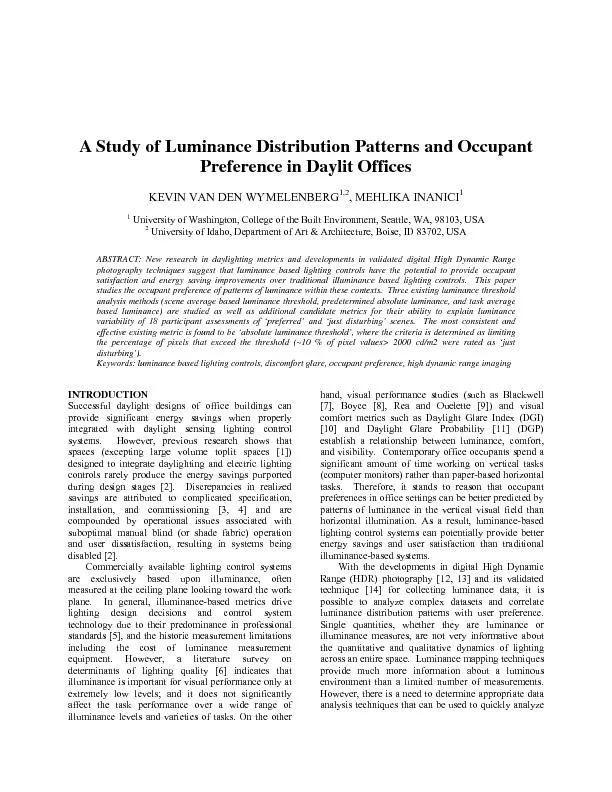
PLEA2009 26th Conference on Passive and Low Energy Architecture Quebec City Canada 2224 June 2009 the information and provide useful feedback for lighting design decisions and control strategies ID: 373883

PLEA2009 26th Conference

Share:

Link:

Embed:

Download Presentation from below link

Download Pdf The PPT/PDF document "A Study of Luminance Distribution Patter..." is the property of its rightful owner. Permission is granted to download and print the materials on this web site for personal, non-commercial use only, and to display it on your personal computer provided you do not modify the materials and that you retain all copyright notices contained in the materials. By downloading content from our website, you accept the terms of this agreement.


Presentation Transcript

A Study of Luminance Distribution Patterns and Occupant Preference in Daylit OfficesKEVIN VAN DEN WYMELENBERG1,2 University of Washington, College of the Built Environment, Seattle, WA, 98103, USA University of Idaho, Department of Art & Architecture, Boise, ID 83702, USA ABSTRACT: New research in daylighting metrics and developments in validated digital High Dynamic Range photography techniques suggest that lu PLEA2009 - 26th Conference on Passive and Low Energy Architecture, Quebec City, Canada, 22-24 June 2009 the information and provide useful feedback for lighting design decisions and control strategies. Recent studies with luminance mapping techniques incorporate a threshold luminance value, where exceeding values are likely to cause occupant discomfort. These studies can be grouped into three areas as follows: Scene average based luminance threshold: Average luminance values are calculated in a large field of view (hemispherical fisheye lenses allow data collection in 180° horizontally and vertically), and the discomfort threshold is determined as the multiplication of the average scene luminance with a constant. Radiance ‘findglare’ tool [15] adopts this method and the default constant is 7. An average luminance value (L) in a scene yields to a luminance threshold of 7*L (i.e. luminance values above 7*L are identified as potential glare sources). Different glare indices, including DGI, are calculated based upon the brightness, location, and apparent size of the glare sources and the background luminance for a particular viewpoint. Predetermined absolute luminance thresholdacceptable luminance threshold is set as a predetermined value. A recent study [16] used 2000 as the threshold value for the average luminance of the unobstructed portion of the window wall. In this research, the threshold value is used to control an automated roller shade system in an open plan office space to control direct sun and window glare while providing an adequate amount of daylight and view to the outdoors. Task average based luminance threshold: Average task luminance is calculated in a given area, and the threshold is determined as the multiplication of the average task luminance with a constant. A new glare metric, DGP [11] utilizes this method, where the threshold value is determined as 4 times the average task luminance. In this research, psychophysical experiments were conducted on 70 subjects under varying daylight conditions in a private office and 349 unique scenes resulted in a squared correlation of 0.94 for DGP as compared to 0.56 for DGI [17]. It is important to note that both Radiance ‘findglare’ tool and DGP allow the user to set a predetermined threshold value. In a simple daylit setting, Howlett et al. proposed a framework for other luminance-based metrics and assessed their temporal and spatial stability [18]. Additionally, Newsham et al. tested other measures with a group of 40 subjects in a ‘glare-free’ office laboratory with low daylight levels (glass 0.20 visible transmittance) to determine which explained the greatest proportion of lighting preferences [19]. Sarkar and his colleagues have demonstrated applications where small cameras collect HDR information and control electric lighting systems in architecturally ts [20, 21]. The research outlined above marks the beginning of a new generation of luminous field control system and metrics research while several important issues remain unresolved. These include concerns regarding occupant privacy with cameras in the workplace, technical challenges associated with physically positioning cameras to adequately control lights and blinds (even in simple private offices, not to mention open office applications or other more complex settings), questions about economic feasibility of such systems so that market uptake is possible, and lack of a foundation of solid human factors research to support design metrics and control algorithms. The aim of this paper is to advance the area of human preference analysis while maintaining the work within the contexts of the lighting and blind control systems, and building design performance analysis metrics. The paper explores methods for analyzing and evaluating the luminance quantities and distribution patterns in an office space under daylight conditions. The three unique luminance threshold methods described above are analyzed in connection with occupant preference, and other candidate metric solutions are reviewed. Accurate predictions of occupant preference under daylight conditions with validated metrics and thresholds will progress the design industry in two significant ways. First, it will help designers make more informed choices among the candidate design solutions, and therefore, improve the quality of daylighting in buildings. Second, it has the potential to significantly propel lighting and shading controls beyond traditional illuminance measures, and therefore, better optimize energy savings while accommodating user preference. METHODOLOGY The research involves collection of large field of view luminance maps and illuminance measurements along with occupant surveys to study the occupant preferences in an office space along with quantitative measurements.The research setting (Fig. 1) is a 3.5m x 4.5m (~16 m) private office with a southwest facing window (33º from true South) exposure in Boise, Idaho (43º N and 116º W). The experiment was conducted on December 16, 2008 between 11:30-16:00. Sky condition varied from sunny to cloudy, bright with haze, and full overcast d u double-gla from the fl o The windo5cm white l manual co n in the room Figure 1: Th c was positi o window w a wall. A 0 computer 255 cd/mwindow w a and mouse a X-rite C p ositioned work surf a Sensor. A d the top of t h supply air d downward location), a n A HDR luminance [12-14]. A camera an d lens was p o with a 0.45center of e y to collect m p lace thro u captured a d sequences computatio calibrated t h lens vignet t optical axi s PLEA2009 - 2 u ring data co l z ed clear with a o or to 3m, and w has two i n l over blinds w i n trol. Electric l during the ex p e research setti n c tangular des k o ned approxi m a ll. The seat e 0 .53m (diago n m onitor (max s was set on t h a ll. The desk a for computer c C olorChecker t the back ed g a ce, and a L d di ional photo m h e monitor po d iffuser mount e toward the d e n d on the roof p hotography ata in a large A Canon EOS d Sigma 8 m m o sitioned in t h m offset (me y es) from the s u m ultiple expos u u ghout the e n d ifferent lumi n w ere assembl e n al methods h rough a self- c t ing (i.e. light s ) was deter m 2 6th Conference o n l lection. Th a luminium fra m span 3.8m fr o n dependent i n i th lift cords a n l ight sources w p erimen . measuring 1 m ately 1m a e d occupants f n al screen di m creen lumina n h e desk perp e a lso had a trad i c ontrol, a low g © Gray Scale g e of the desk L i-Cor 210 S m etric sensors inted toward t h e d 3m above t h e sk surface (t y of the buildin g t echnique was (180 by 180 -1 Ds Mark I m F3.5 DG C h e plane of th e asured from c u bject. This c a u re sequences a n tire study. n ance range a n e d into an H D [22]. The c alibration algfalloff of pix e m ined and co r n Passive and Lo w e windows a r m es and exte n om wall to wa l n terior mount e n d tilt wands f o w ere not p rese .52m x 0.76 m a way from t h f aced a paint e m ension) LC D n ce measured a e ndicular to t h i tional keyboa r g loss magazin e Balance Ca r mounted on t h A Photometr i were placed o h e ceiling, on h e floor point e y pical photoc e g . used to colle c ) field of vie w I II Digital SL R C ircular Fishe y e subjects’ ey e enter of lens t a mera was us e a nd was fixed i Each exposu r n d the ex p osu R image usi n camera w a orithm. Fishe y e ls far from t h r rected throu g w Energy Architec r e m h a ll t R y d n e e imag calibrMino hotowher quant the femalactivi 18-3 h heigh interi refe work, an onin or d b oth instru regar situat amou deter enter demo heigh onto instru minu imme lind distur refe ture, Quebec City e post proce s ated using a l ta LS-110 Lu m graph is an ac e pixel quantit i i ties of lumina n The partic i U niversity of e and 11 m t ies during t h e en 20-30 min u 9 years and t h ipants had a c tive glasses a t ed). h e participants t and tilt for o r lighting co n r able’ lumino u d position for under the p r e d another in t i ved as ‘just d line survey a n d er to be able t o computer an d cted to consid e e rable’ but m o d ed as the poi n i on (i.e. adjust r imental Pro c s tudy used a r participant p o n t and distri b m ined the sce n disturbing’ ipan entered t ed. To begi n e d the office , c t’s consent f n stration of h t and louver t a n online surv e ctions of ho w ipants began t h y tool to leav e t es) during t h n ces that wer e multiple e x diately after s to either b ing’ setting a r ence online q u , Canada, 22-24 J u s sing, and e a gray card v a m inance Mete r curate lumina n i es closely cor r n ce (in cd/ ) . i pants were ar c Idaho. Eig h m ale) comple t h e period of s u tes. Particip a h e mean age a ny color bl i a nd 17% wor e were directe d both blinds i n n dition they p e u s environme n the primary p r evailing sky t erior lighting d isturbing’. P a n d were prov i o determine a p d paper tasks . e r ‘just disturb i o re than ‘notic e n t at which t h the blinds) if i c edure epeated mea s o sitioned the b b ution of day n e to be the ‘ l igh ing con d the office, t h n the experi m , completed t f or , and the h ow to manua l t ilt. The par t e y tool and w e w to comple t h e study and w e the room (f o h e multiple e e later assembl x posure seq u the pa r ticipa their ‘most a nd had compl e u estionnaire. u ne 2009 a ch scene w a a lue captured r . The resulta n n ce map of th e r espond with p . hitecture stu d h teen particip a t ed basic c o s tudy for a d a nt ages rang e was 25 year i ndness, 28 % e contact lens e d to manipula t n order to cr e e rceived as th e n t ossible fro m p urposes of c o condition. Th e condition th a a rticipants co m i ded with a m a p propriate ligh t . Participant i ng’ glare as l e e able’ glare; a h ey would cor r i t occurred nat u s ures design w b linds to mo d light such th a most preferab d ition. Befor e h e blinds we r m ent the par t t he required n watched a l ly adjust bot h t icipants then e re given brie f t e the study. w ere prompte d o r approximat e e xposure ed into HDR i u ences were n ts had adjus t preferred’ o r e ted the short l After each ex p a s spot with a n t HDR e scene, p hysical ents at a nts (7 o mputer uration d from s. No % wore e s (self t e blind e ate the e ‘most m their o mputer y also a t they m pleted ing for s were e ss than a nd it is r ect the u rally. hereby ify the a t they le’ and e each r e fully t icipant human simple blind logged verbal The d by the e ly two t ograph mages. taken ed the r ‘just l ighting osure- b racketed were prom p the study. I n randomize create thei r scenes. F i defined as “ the particip a Figure 2: T h create “ju s luminous en v Over the c o combinatio recorded re s 18 ‘just d i illuminatio candidate among oc c luminance survey too l each scene t visual envi r very stron g ‘preferred’ four their abilit y The results illuminanc articipant luminance Averag e cases for t h and ‘just diresult is t h distinguish lighting co n scenes oc c PLEA2009 - 2 s equence was p ted to r e-ente order to min i d the sequen c r ‘most pre fe i gures 2 dem o “ just disturbi n a nts. h e blind positi o s t disturbing” (l v ironment. o urse of the t w n s of sky con d s ulting in a da t i sturbing’ sc e n data were a etrics best c upant prefe r patterns in t h l assed partic i while it also t s were able t r onment. Al l g ly agreed th a setting, whil e i pants were n y were analyz e e measurem e questionnair re performe d t hreshold met h e scene lumin a h eir ability to e sturbing’ scen e h at an aver a e d for the ana l n ditions, abov e c ur ( ~ 800 c d 2 6th Conference o n completed, the room an d i mize the bias , c e instructing e rred’ and ‘j o nstrates the s n g” and “prefe r o ns adjusted by (l eft) and “p r w o-day study, s d ition and blin t a set with 18 ‘ nes. HDR p h n alyzed in ord e explained th r ence ratings h e office spa c i pants’ visual recorded the e t o c r eate a ‘ j l subjects str o a t they were a e due to wea t ot absolutely sturbing’ envi r d using lumi n e nts in co n e response. d to study e h ods described a nces were st u e xplain varian c e s (Fig. 3). T h a ge threshold l yzed office u n e which only ‘ d ), howev n Passive and Lo w t he participan t d continued wi t , the survey to o participants ust disturbin g s cenes that a r r red” y one o a participant t r eferred” (righ s everal differe n d position we r ‘ preferable’ a n h otographs a n e r to see whi c e relationshi p and daylig h c e. The onli n preference f o e xtent to whi c j ust disturbin g o ngly agreed o a ble to create t her conditionconfident wi t r onment. ance maps a n n junction wi t The followi n e ach of thr e earlier. died for all 3 c e of ‘preferre d h e most notab l value can b n der the studi e ‘ just disturbin g er, below t h w Energy Architec t s t d h g thres distur thres “just has a set b y p artic and ‘ p the illust indic rovehighe the a v ‘just thresh P r 3000 refe that ‘ p value simil 3000 T o p revi thres lumi ture, Quebec City h old value, th e b ing’ scenes. h old average s c disturbing’ e scene thr e that a ‘just dihigher scene y the same p ipant 12 w a tically incre a p referred’ sce n e 3: A verage s c s (‘jd’stands fo r r red’ scenes). h e percentage a verage scen e r ated below ( a tes potentiall y s to be incons i r percentage o v erage scene l d isturbing’ sce n e 4: Percenta g o ld of ‘7 times t h r edetermined l u cd/ ) were a r red and just d p referred’ sce s exceeding 2 a r result at les s c d/ . o assess the o usly, task l u h old was set n ance’. Avera g , Canada, 22-24 J u e re is a mix o f Therefore, it i c ene luminan c a nd ‘preferre d e shold metric sturbing’ sce n average than p articipant. T h w here the o a sed between n e. ene luminance s r ‘just disturbi n of pixel value s e luminance ( Fig. 4). A y larger glare i stent, in that s o f pixel values l uminance’ fo r n es. e o f pixel v a h e average scen e u minance val u a lso studied t o d isturbing sce n nes have less 2 000 cd/m n s than 8% of p i third thresho l u minance was as ‘4 time g e task lumin a u ne 2009 f ‘preferred’ a n s not possible c e value to de m d ’ scenes. Yis consistent n e set by a par t the ‘preferred h e only exce p o utdoor illu m the ‘just dist u s (cd/m2) for a n g’ and ‘p’ st a s that exceed 7 for each s c A higher per c sources. This s ome data sets that exceed ‘ 7 r ‘preferred’ t h a lues that exc e e luminance ’ u es (2000 cd/ m o explain vari a n es. Figure 5than ~10% o n d Figure 6 s h i xel values ex c l d method d e calculated, s the avera g a nce is calcul a n d ‘just to set a m et, the in the t icipant ’ scene p tion is m ination rbing’ a nalyzed nds for 7 times c ene is c entage metric have a 7 times h an for e ed the m 2 and a shows o f pixel h ows a c eeding e scribed nd the g e task a ted as the averag e and the c o p ercentage metric pro v and betweethe percent a average sc e scene than f Figure 5: predetermin Figure 6: predetermin Figure 7: P DISCUSSIThis paper threshold (ii) predet e average baabsence of g In isol a explained instance, in ‘preferred’ 2,000 cd/ m PLEA2009 - 2 e of the pixel s o mputer scre e of pixels tha t v ides unstable r n subject me a a ge of pixel v a e ne luminance f or the ‘just di s Percentage o f e d luminance th r Percentage o f e d luminance th r P ercentage of ‘4 times the ave r ONS AND C O investigates t h m etrics, (i) sc e e rmined absol u sed threshold g la e in a lumi n a tion, none o t he variabilit y all 36 scenes ( scene), had m m . However , 2 6th Conference o n s that corresp o e n. Figure 7 t exceed the t h r esults for bot h a sures. For m o a lues that exc e ’ is higher in s turbing’ scen e f pixel values r eshold value o f f pixel values r eshold value o f pixel values r age task lumin a O NCLUSIO e three prac t e ne average b u te threshold,to identify t h n ous environ m o f these met r y of scene p ( even the dark e m any pixel val u , extending t h n Passive and Lo w o nd to the de s illustrates t h h reshold. Th i h within subje c o st participant e ed ‘4 times t h the ‘preferre d e that exceed f 2,000 cd/mthat exceed f 3,000 cd/mthat exceed t h a nce N t iced luminan c b ased threshol d and (iii) ta s h e presence o m en . r ics adequate l p reference. F o e st overcast s k u es in excess o h e 2,000-cd/ m w Energy Architec s k h thres incre gener value good From the d e sourc of pi x visua o For i n identi Table Severattem intere consi thres is aff e lumi variat ture, Quebec City h old with a pr o n tage of pixe l a ses its usef u a l, it is diffic u s since they m t ions, such as p lighting quali t a practical st a t ions and glar e e termining fac t e with high lu m x el values exc e of high lumi n l discomfort. o th predeterm i s tent results f o c t measures, o ds did not. It n stance, task l u fication of t n dent upon pos1: Summary of a al additional p t to better e sting to note a rd deviation s tent metric w e st proportion h old (=1610 cted both fro n ance distrib u ions create , Canada, 22-24 J u o portional val u l s exceeding t u lness and p u lt to interpre t m ay point to u p oor visibility t ies such as h i a ndpoint, highl i e are pro d uce or becomes t h m inance [23]. I e eding the thr e n ance, therefor i ned absolute o r both within whereas the is also the lea s u minance-bas he tas k are a ition and scen e a nalyzed metric s metrics wer e e xplain the d a that a simp l of scene lum i w ithin subjectof just distur b c d/ ). The m the averag e u tion [24]. A a stimulati n u ne 2009 u e (10%) to de f t he threshold redictive abi l t the high lu m u nsatisfactory and discomfo r i ghlights and s i ghts, sparkle, d similarly; th e h e angular siz e I ncreased perc e e shold indicat e e, higher pote n thresholds subject and b othe two th r s t complicated e d metric requ i a , and there f e stability. s e considered a ta (Table 1). l e variability i nance, was t h s and explai n b ing scenes ab o adaptation lu m e and the vari a A dequate lu m n g and int e f ine the greatly ity. In m inance ighting t, or to s parkle. veiling refore, of the e ntages larger n tial of r ovided etween metric. res the f ore it in an It is metric, e most n ed the o ve the m inance nce of m inance PLEA2009 - 26th Conference on Passive and Low Energy Architecture, Quebec City, Canada, 22-24 June 2009 environment that improves the preference ratings of the occupants, whereas excessive luminance variability tends toward creating uncomfortable spaces. The ability of several metrics examined to consistently differentiate preferred scenes from just disturbing scenes is encouraging. However, as expected, it is difficult to establish two-way threshold (above x = comfort, below x = discomfort) due to several known dynamic variables (individual preference, temporal variability, setting variability). This suggests that calibration for luminance controls under various settings is straightforward and makes predictive modelling difficult because of its dependency on occupant positions. These results suggest that the most practical approach for assessment of the three current methods is the ‘predetermined absolute luminance threshold’ measure. As the next step, this line of research will be expanded to investigate other potential metrics for effective luminance assessment within additional settings and daylighting conditions for use with automated lighting and blind controls and for predictive design performance assessment. REFERENCES 1. McHugh, J., A. Pande, G. Ander, J. Melnyk, (2004). Effectiveness of Photocontrols with Skylighting. IESNA Annual Conference Proceedings2. Heschong, L., O. Howlett, J. McHugh, A. Pande, (2005). Sidelighting Photocontrols Field Study, [Online], Available: http://www.h-m-g.com/downloads.htm [20, January 2009]. 3. Rubinstein, F., D.Avery, J. Jennings, (1997). On the Calibration and Commissioning of Lighting Controls. In Proceedings of the Right Light 4 Conference. Copenhagen, 4. Rubinstein, F., J. Jennings, D. Avery, S. Blanc, (1998). Preliminary results from an advanced lighting controls testbed. In Proceedings of the IESNA 1998 Annual Conference. San Antonio, TX, USA, August 10-12. 5. Rea, M., (2000). IESNA Lighting Handbook. 9th ed. Illuminating Engineering Society of North America6. Veitch, J. and G. Newsham, (1996). Determinants of lighting quality II: Research and recommendations. In Annual Convention of American Psychological AssociationToronto, Canada, August 12. 7. Blackwell, R., (1959). Development and use of a quantitative method for specification of interior illumination levels on the basis of performance data. , 54: 317-353. 8. Boyce P., (1973). Age, illuminance, visual performance and preference. Lighting Research and Technology, 5: 125-9. Rea M., M. Ouellette, (1991). Relative visual performance: a basis for application. Lighting Research and Technology10. Hopkinson, R., (1972). Glare from daylighting in , 3(4): p. 206-215. 11. Wienold J. and J. Christoffersen, (2006). Evaluation methods and development of a new glare prediction model for daylight environments with the use of CCD cameras. Energy and Buildings, 38(7): p.743-757. 12. Debevec, P. and J. Malik, (1997). Recovering high dynamic range radiance maps from photographs. In ACM SIGGRAPH Proceedings of the 24th Annual Conference on Computer Graphics and Interactive Techniques, p. 369-378. 13. Reinhard, E., G. Ward, S. Pattanaik, P. Debevec, (2005). High Dynamic Range Imaging: Acquisition, Display, and Image-Based Lighting. Har/Dvdr. Morgan Kaufmann. 14. Inanici, M., (2006). Evaluation of high dynamic range photography as a luminance data acquisition system. Lighting Research and Technology, 38(2): p. 123-134. 15. Ward, G., (1992). Radiance Visual Comfort Calculation. [Online], Available: radiance/refer/Notes /glare.html [20 January 2009]. 16. Lee, E., R. Clear, G. Ward, L. Fernandes, (2007). Commissioning and Verification Procedures for the Automated Roller Shade System at The New York Times Headquarters, New York, New York. [Online], Available: mm_perf/nyt_pubs.html [20 January 2009]. 17. Chauvel P., J. Collins, R. Dogniaux, J. Longmore, (1982). Glare from windows: current views of the problem. Research and Technology, 14(1): p. 31-46. 18. Howlett O., L. Heschong, J. McHugh, (2007). Scoping Study for Daylight Metrics from Luminance Maps. Leukos19. Newsham, G., M. Aries, S. Mancini, G. Faye, (2008). Individual control of electric lighting in a daylit space. Lighting Research and Technology, 40(1): p. 25-41. 20. Sarkar, A. and R. Mistrick, (2006). A Novel Lighting Control System Integrating High Dynamic Range Imaging , 2(4): p. 307-322. 21. Sarkar A., M. Fairchild, C. Salvaggio, (2008). Integrated daylight harvesting and occupancy detection using digital imaging. In Sensors, Cameras, and Systems for Industrial/Scientific Applications IX. Vol. 6816. San Jose, CA, USA. [14 February 2008] p. 68160F-12. 22. Ward, G. Universal version of Photosphere. [Online] Available: www.anyhere.com [20 January 2009]. 23. Worthey, J., (1991). Light Source Area, Shading, and Glare, Journal of the IES, 20(2): p. 29-36. 24. Ishida, T. and K. Iriyama, (2003). Estimating Light Adaptation Levels for Visual Environments with Complicated Luminance Distribution. In Proceedings of the CIE 2003 Conference. San Diego, CA, USA, June 26-28.