/
Advancements in Operational CMAQ MODIS AOD Data-Assimilatio Advancements in Operational CMAQ MODIS AOD Data-Assimilatio

Advancements in Operational CMAQ MODIS AOD Data-Assimilatio - PowerPoint Presentation

danika-pritchard
danika-pritchard . @danika-pritchard
Follow
435 views
Uploaded On 2015-12-12

Advancements in Operational CMAQ MODIS AOD Data-Assimilatio - PPT Presentation

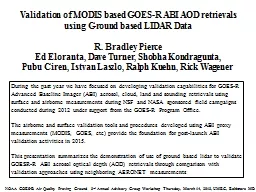
John N McHenry Jeff Vukovich Don Olerud and WT Smith Baron Advanced Meteorological Systems Review of the MODISDA Modeling Component Review of Preliminary RealTime Testing Results ID: 221912

initial season pm2 day season initial day pm2 warm cool forecast performance analysis improved system surface modis bias time

Share:

Link:

Embed:

Download Presentation from below link

Download Presentation The PPT/PDF document "Advancements in Operational CMAQ MODIS A..." is the property of its rightful owner. Permission is granted to download and print the materials on this web site for personal, non-commercial use only, and to display it on your personal computer provided you do not modify the materials and that you retain all copyright notices contained in the materials. By downloading content from our website, you accept the terms of this agreement.


Presentation Transcript

Slide1

Advancements in Operational CMAQ MODIS AOD Data-Assimilation at Baron Advanced Meteorological Systems During Forecast Year 2013

John N. McHenry,

Jeff

Vukovich

, Don

Olerud

, and W.T. Smith

Baron Advanced Meteorological SystemsSlide2

Review of the MODIS-DA Modeling Component

Review of Preliminary Real-Time Testing Results

Improvements: Assimilating Surface PM2.5 ObservationsInitial Performance Analysis of Improved SystemUp-coming Enhancements

Outline of the TalkSlide3

Review of the MODIS-DA Modeling Component

The promise of chemical data assimilation: An Example

Day 1 Forecast

Day 2 Forecast

No MODIS Assimilation MODIS Tau AssimilationSlide4

Review of the MODIS-DA Modeling Component

CMAQ-DA 2DVAR Algorithm Development

Partnering with the VISTA RPO, NCDENR and NASA, BAMS developed/tested/evaluated assimilation of MODIS AOD data into CMAQ V4.51 (soamods, CB4) using 2002 surface observations and annual run-results. The software implements a 2-D Variational Data-Assimilation system that produces an optimal AOD “analysis” through statistical blending between background CMAQ AOD and observed MODIS AOD.

MODIS AOD is captured using both “Dark Target” and “Deep Blue” algorithms, the “Deep Blue” providing additional coverage over bright reflecting surfaces (Collection 5).Slide5

Is the “forward operator”

Is the data-assimilation step (variational optimization)

Is the inverse operator

Review of the MODIS-DA Modeling ComponentSlide6

Review of Initial Real-Time Experimental Implementation and Testing

Late-Fall; 19-day period after DA spin-up

In November 2012, BAMS implemented a real-time version of the system, running on the “EPA-36km” CONUS grid w/ 19-layers (identical to the VISTAS configuration)

The initial system was designed to produce real-time

optimal AOD “

analyses

using 2DVAR; but not forecasts.

The objective was to evaluate whether or not the analyses improve against “none-assimilated” vanilla cycling, starting with evaluation of total surface PM2.5.Slide7

Initial Real-Time Experimental Implementation and Testing

Late-Fall; 19-day period after DA spin-up – December 10

Improved areas circled blue

Degraded areas circled red

Mexican biomass burn event

AirNow 24-hour average PM2.5 surface measurements as diamonds against CMAQ_DA 24-hr average (06z-06z) Slide8

Initial Real-Time Experimental Implementation and Testing

Late-Fall; 19-day period after DA spin-up – November 30

Improved areas circled blue

Degraded areas circled red

AirNow 24-hour average PM2.5 surface measurements as diamonds against CMAQ_DA 24-hr average (06z-06z) Slide9

Initial Real-Time Experimental Implementation and Testing

Late-Fall; 19-day period after DA spin-up

Representative improvements in California (dust components probable)

Glendora-Laurel

site in LA county

AnaheimSlide10

Initial Real-Time Experimental Implementation and Testing

Late-Fall; 19-day period after DA spin-up

Representative improvements in Texas/Desert SW (biomass burning in Mexico)

Harris County TX

Clark County Nevada

Corpus Christi TXSlide11

Initial Real-Time Experimental Implementation and Testing

Late-Fall; 19-day period after DA spin-up

Representative improvements in Florida (modest biomass burning)

Melbourne – Brevard County

Dunn Ave – Volusia CountySlide12

Initial Real-Time Experimental Implementation and Testing

Late-Fall; 19-day period after DA spin-up:

Time-series of performance statistics in the East

0.00 Bias

line

Big improvement in skill first three days; little change in skill rest of period (clouds likely a big issue)Slide13

Initial Real-Time Experimental Implementation and Testing

Late-Fall; 19-day period after DA spin-up:

Time series of performance statistics in the West

0.00 Bias

line

Major improvement in Bias throughout period

Larger Errors days 2-6

Smaller Errors days 10-14Slide14

Initial evaluation of 19-day late fall period against daily-average AirNow surface PM2.5 (TEOM) shows:

Significant improvement in the East first three days and little change later (clouds)

Much improved bias in West over entire periodDegraded error in the West days 2-6

Modest improved error in the West days 10-14

On going work reported at that time:

When it occurs, worsening of performance at the surface may result from

not distinguishing

aerosols aloft in MODIS: will be bringing in observed

surface PM2.5 in upcoming scheme revision => FOCUS of this talk: impacts

Tuning of correlation length-scale in 2DVAR scheme may be needed (DONE)A minor difference in AOD calculation between CMAQ and MODIS may be contributing some small unwanted bias in the final AOD “analysis.” We are looking at this. (UNNEEDED)Plan to migrate to operational status in the late spring/early summer time frame. (DONE – Now running 1x daily 60-hour forecasts, 06Z Cycle)

Initial Real-Time Experimental Implementation and TestingSlide15

Improvements: Assimilating Surface PM2.5 Observations

Initial “Inverse Operator”

Had only linear-scaling in the vertical to match the assimilated AOD result

Once the Tau increment is known in each CMAQ vertical column, the non-linear revised-IMPROVE equations are iterated to recover the newly analyzed aerosol optical depth by adjusting the aerosol constituents:

For increasing Tau, all background accumulation or coarse mode aerosol species concentrations are adjusted upwards except:

Over the ocean: sulfates, nitrates, and chlorine

Near the coastline: sulfates

Inland: sulfates, sea-salts

For decreasing Tau, all accumulation and coarse mode species may be adjusted downward

Nothing is done to adjust modeled NO2, which is assumed “as good as can be” in the model due to its short life-time and relatively local nature

Further species discrimination in the iterated-inverse adjustment is made based on “smoke” versus “dust” categorizations available from MODISSlide16

Analysis showed that when MODIS detected a higher AOD than the initial CMAQ estimate, the inversion-step back to model concentrations sometimes resulted in CMAQ surface PM2.5 that was “too hot”. This implied that relatively more of the increased concentration should be place above the PBL.

The revised inversion step makes use of surface PM2.5 to mitigate the above: modeled PBL heights are used to preferentially nudge model concentrations above the PBL more heavily such that the resulting modeled surface PM2.5 does not exceed the “gridded-observed” PM2.5. This is a first improvement – with more to come (discussed later).

Revised “Inverse Operator” preferentially nudges concentrations in the vertical with different weights to match both the assimilated (final analyzed) total column AOD result *and* to ensure the surface PM2.5 values do not exceed the observations – when TAU increases due to the assimilation. Further, over the ocean, TAU increases always result in nudged model concentrations above the PBL only.

Improvements: Assimilating Surface PM2.5 ObservationsSlide17

Initial Performance Analysis of Improved System

CMAQ is being run in both “vanilla” mode (non-DA cycling and forecast) and “MODIS-DA” mode (cycling and forecast) using the newly implemented surface PM2.5 data

Runs began in late Spring and continued through Summer/Fall/Winter

Due to occasional MODIS outages and network glitches, the dataset is not continuous but features about 170 total model days for comparison

Preliminary analyses of both the final analysis (initial condition) and the day-1 and day-2 forecast results comparing “vanilla” and “MODIS-DA” were completed, with a focus on daily-average total surface PM2.5 observations as reported through the AIRNow “gateway”

Performance in six CONUS sub-regions and “warm” (87 days) versus “cold” (84 days) season has been looked at to-date.Slide18

Initial Performance Analysis of Improved System

NORTHEAST: Warm Season

NORTHEAST: Cool Season

24-H

PM2.5 for the “Initial Condition” Day

Warm Season:

Vanilla

Warm

Season:

Assim

Cool Season: Vanilla

Cool Season:

Assim

Obs Average

9.4892

9.4903

8.9299

8.9295

Model Average

11.3393

11.7308

11.6631

11.3698

Bias

1.8501

2.2405

2.7332

2.4403

Error

3.9706

4.0225

4.6090

4.2325

RMSE

5.3682

5.3158

6.2488

5.6503

Normalized Bias

-0.6187

-0.7013

-0.5975

-0.5905

GRS_ERR

0.7974

0.8415

0.7728

0.7476

Slope

0.6852

0.6457

0.8309

0.7623

R2

0.3639

0.3680

0.4316

0.4485

Indx_Agree

0.7458

0.7390

0.7581

0.7787Slide19

Initial Performance Analysis of Improved System

SOUTHEAST: Warm Season

SOUTHEAST: Cool Season

24-H

PM2.5 for the “Initial Condition” Day

Warm Season:

Vanilla

Warm

Season:

Assim

Cool Season: Vanilla

Cool Season:

Assim

Obs Average

8.9794

8.9794

8.5046

8.5046

Model Average

9.4492

9.8256

10.8820

9.9118

Bias

0.4698

0.8462

2.3775

1.4073

Error

3.7810

3.5101

4.2870

3.3491

RMSE

4.9334

4.5689

5.6884

4.3162

Normalized Bias

-0.1338

-0.1961

-0.3577

-0.2745

GRS_ERR

0.4915

0.4786

0.5703

0.4819

Slope

0.7884

0.7842

0.9771

0.7245

R2

0.2774

0.3139

0.3456

0.3330

Indx_Agree

0.6918

0.7177

0.6681

0.7241Slide20

Initial Performance Analysis of Improved System

NORTHCENTRAL: Warm Season

NORTHCENTRAL: Cool Season

24-H

PM2.5 for the “Initial Condition” Day

Warm Season:

Vanilla

Warm

Season:

Assim

Cool Season: Vanilla

Cool Season:

Assim

Obs Average

8.4975

8.4975

7.3967

7.3967

Model Average

8.5006

9.3410

9.8986

10.0487

Bias

0.0031

0.8435

2.5019

2.6520

Error

3.8677

3.5039

4.1232

4.0919

RMSE

5.1564

4.5714

5.4603

5.2517

Normalized Bias

-0.4563

-0.5863

-0.9653

-1.0584

GRS_ERR

0.7905

0.8151

1.1210

1.1852

Slope

0.4748

0.5858

0.7298

0.6446

R2

0.2362

0.3672

0.3899

0.3848

Indx_Agree

0.6929

0.7646

0.7405

0.7374Slide21

Initial Performance Analysis of Improved System

SOUTHCENTRAL: Warm Season

SOUTHCENTRAL: Cool Season

24-H

PM2.5 for the “Initial Condition” Day

Warm Season:

Vanilla

Warm

Season:

Assim

Cool Season: Vanilla

Cool Season:

Assim

Obs Average

10.7651

10.7651

7.5871

7.5871

Model Average

8.0966

9.3495

10.0786

9.7353

Bias

-2.6685

-1.4156

2.4915

2.1482

Error

5.2390

4.3226

3.8805

3.4518

RMSE

7.1678

6.0735

5.0084

4.4572

Normalized Bias

0.1081

-0.0087

-0.4829

-0.4570

GRS_ERR

0.5054

0.4389

0.6321

0.5935

Slope

0.2143

0.3447

0.8278

0.7379

R2

0.0508

0.1394

0.3337

0.3392

Indx_Agree

0.5321

0.6209

0.6742

0.6981Slide22

Initial Performance Analysis of Improved System

NORTHWEST: Warm Season

NORTHWEST: Cool Season

24-H

PM2.5 for the “Initial Condition” Day

Warm Season:

Vanilla

Warm

Season:

Assim

Cool Season: Vanilla

Cool Season:

Assim

Obs Average

5.9655

5.9654

10.1270

10.1262

Model Average

7.3653

8.5235

9.1197

9.9441

Bias

1.3998

2.5580

-1.0073

-0.1821

Error

3.7657

4.1580

5.6625

5.6466

RMSE

5.8865

6.1070

8.3292

8.2278

Normalized Bias

-0.7261

-1.0032

-0.3036

-0.4143

GRS_ERR

0.9636

1.1435

0.7911

0.8273

Slope

0.3596

0.4126

0.3460

0.3830

R2

0.1433

0.1814

0.1314

0.1508

Indx_Agree

0.5858

0.6020

0.6100

0.6277Slide23

Initial Performance Analysis of Improved System

SOUTHWEST: Warm Season

SOUTHWEST: Cool Season

24-H

PM2.5 for the “Initial Condition” Day

Warm Season:

Vanilla

Warm

Season:

Assim

Cool Season: Vanilla

Cool Season:

Assim

Obs Average

10.0840

10.0840

9.7894

9.7894

Model Average

6.6088

9.5934

7.9285

9.6457

Bias

-3.4752

-0.4907

-1.8609

-0.1437

Error

4.4826

3.6731

4.3985

4.2887

RMSE

6.0941

4.9921

7.7269

7.2445

Normalized Bias

0.1134

-0.2408

-0.2299

-0.4758

GRS_ERR

0.5091

0.5291

0.6513

0.7421

Slope

0.2826

0.4176

0.2295

0.2962

R2

0.2773

0.3188

0.2090

0.2641

Indx_Agree

0.6099

0.7276

0.5688

0.6417

= MODIS assimilation improves

= Vanilla Model BetterSlide24

Initial Performance Analysis of Improved System

Summary for 24-H Average “Initial Condition” Day

Region/

Season

Much

Improves

Modest

Improves

Wash

Modest DegradesMuch DegradesNE - Warm

X

NE - Cool

X

SE- Warm

X

SE- Cool

X

NC - Warm

X

NC -

Cool

X

SC - Warm

X

SC - Cool

X

NW

- Warm

x

x

NW - Cool

X

SW - Warm

X

SW

- Cool

XSlide25

Initial Performance Analysis of Improved System (Forecast Day 1)

NORTHEAST: Warm Season

NORTHEAST: Cool Season

24-H

PM2.5 for Forecast Day 1

Warm Season:

Vanilla

Warm

Season:

Assim

Cool Season: Vanilla

Cool Season:

Assim

Obs Average

9.6581

9.6581

9.0390

9.0390

Model Average

12.5987

12.830

10.7943

10.9560

Bias

2.9406

3.1721

1.7553

1.9170

Error

4.5326

4.6120

4.1786

4.2029

RMSE

5.9302

5.9293

5.8390

5.7761

Normalized Bias

-0.7848

-0.8636

-0.4396

-0.4798

GRS_ERR

0.9149

0.9733

0.6620

0.6848

Slope

0.7511

0.6858

0.7721

0.7442

R2

0.4060

0.3884

0.3981

0.3953

Indx_Agree

0.7420

0.7281

0.7625

0.7612Slide26

Initial Performance Analysis of Improved System (Forecast Day 1)

SOUTHEAST: Warm Season

SOUTHEAST: Cool Season

24-H

PM2.5 for Forecast Day 1

Warm Season:

Vanilla

Warm

Season:

Assim

Cool Season: Vanilla

Cool Season:

Assim

Obs Average

9.6884

9.6884

8.3130

8.3130

Model Average

11.0597

11.1168

10.1139

9.8767

Bias

1.3713

1.4284

1.8009

1.5636

Error

4.2794

3.9480

3.8600

3.4882

RMSE

5.5189

5.0876

5.3012

4.6218

Normalized Bias

-0.2086

-0.2406

-0.3168

-0.3153

GRS_ERR

0.5218

0.5041

0.5360

0.5150

Slope

0.9835

0.9050

0.8296

0.6756

R2

0.3902

0.3954

0.2933

0.2791

Indx_Agree

0.7334

0.7480

0.6663

0.6873Slide27

Initial Performance Analysis of Improved System (Forecast Day 1)

NORTHCENTRAL: Warm Season

NORTHCENTRAL: Cool Season

24-H

PM2.5 for Forecast Day 1

Warm Season:

Vanilla

Warm

Season:

Assim

Cool Season: Vanilla

Cool Season:

Assim

Obs Average

8.7452

8.7452

7.1887

7.1887

Model Average

9.7957

10.1806

8.8249

9.3056

Bias

1.0505

1.4354

1.6363

2.1169

Error

4.0946

3.8036

3.7130

3.9892

RMSE

5.3778

4.9266

5.0187

5.2588

Normalized Bias

-0.5817

-0.6791

-0.7679

-0.8983

GRS_ERR

0.8424

0.8793

0.9800

1.0843

Slope

0.5890

0.6117

0.6963

0.6658

R2

0.2779

0.3471

0.3795

0.3567

Indx_Agree

0.7096

0.7446

0.7576

0.7372Slide28

Initial Performance Analysis of Improved System (Forecast Day 1)

SOUTHCENTRAL: Warm Season

SOUTHCENTRAL: Cool Season

24-H

PM2.5 for Forecast Day 1

Warm Season:

Vanilla

Warm

Season:

Assim

Cool Season: Vanilla

Cool Season:

Assim

Obs Average

10.6229

10.6229

7.4183

7.4183

Model Average

9.2387

9.8272

9.9363

10.1771

Bias

-1.3842

-0.7957

2.5181

2.7588

Error

4.7887

4.1853

3.8478

3.9387

RMSE

6.5350

5.7681

5.0821

5.1287

Normalized Bias

0.0019

-0.0555

-0.4931

-0.5511

GRS_ERR

0.4830

0.4412

0.6345

0.6734

Slope

0.3721

0.4423

0.7858

0.7490

R2

0.1172

0.1891

0.3164

0.3080

Indx_Agree

0.6118

0.6676

0.6655

0.6545Slide29

Initial Performance Analysis of Improved System (Forecast Day 1)

NORTHWEST: Warm Season

NORTHWEST: Cool Season

24-H

PM2.5 for Forecast Day 1

Warm Season:

Vanilla

Warm

Season:

Assim

Cool Season: Vanilla

Cool Season:

Assim

Obs Average

6.7436

6.7436

11.1464

11.1464

Model Average

8.2023

9.3247

9.5097

10.2945

Bias

1.4587

2.5811

-1.6366

-0.8519

Error

4.4989

4.9322

6.4172

6.5298

RMSE

8.9164

9.0930

9.5400

9.5824

Normalized Bias

-0.7885

-1.0372

-0.2793

-0.3797

GRS_ERR

1.0331

1.2022

0.8077

0.8533

Slope

0.2797

0.2987

0.2883

0.3118

R2

0.1207

0.1338

0.1089

0.1148

Indx_Agree

0.5353

0.5451

0.5840

0.5923Slide30

Initial Performance Analysis of Improved System (Forecast Day 1)

SOUTHWEST: Warm Season

SOUTHWEST: Cool Season

24-H

PM2.5 for

tForecast

Day 1

Warm Season:

Vanilla

Warm

Season:

Assim

Cool Season: Vanilla

Cool Season:

Assim

Obs Average

9.1875

9.1875

10.7642

10.7642

Model Average

6.6119

8.6395

8.2219

9.6807

Bias

-2.5756

-0.5481

-2.5422

-1.0835

Error

3.8862

3.4981

5.2312

5.2071

RMSE

5.5024

4.8640

9.7225

9.4398

Normalized Bias

0.0183

-0.2531

-0.2369

-0.4473

GRS_ERR

0.4991

0.5475

0.6862

0.7729

Slope

0.2760

0.3700

0.1779

0.2007

R2

0.2682

0.2956

0.1604

0.1666

Indx_Agree

0.6200

0.7027

0.5017

0.5318

= MODIS assimilation improves

= Vanilla Model BetterSlide31

Initial Performance Analysis of Improved System (Forecast Day 1)

Summary for 24-H Average Day 1 Forecast (06z – 06z)

Region/

Season

Much

Improves

Modest

Improves

Wash

Modest DegradesMuch DegradesNE - Warm

x

NE - Cool

x

x

SE- Warm

X

SE- Cool

X

NC - Warm

X

NC -

Cool

X

SC - Warm

X

SC - Cool

X

NW

- Warm

x

x

NW - Cool

X

SW - Warm

X

SW

- Cool

XSlide32

Initial Performance Analysis of Improved System (Forecast Day 2)

NORTHEAST: Warm Season

NORTHEAST: Cool Season

24-H

PM2.5 for Forecast Day 2

Warm Season:

Vanilla

Warm

Season:

Assim

Cool Season: Vanilla

Cool Season:

Assim

Obs Average

9.6701

9.6701

9.0225

9.0225

Model Average

11.8277

12.2231

10.6047

10.8030

Bias

2.1577

2.5530

1.5822

1.7805

Error

4.4104

4.5648

4.2075

4.3063

RMSE

5.8506

5.9918

5.9172

5.9594

Normalized Bias

-0.6877

-0.7633

-0.4318

-0.4663

GRS_ERR

0.8692

0.9198

0.6673

0.6913

Slope

0.6686

0.6426

0.7249

0.7172

R2

0.3366

0.3252

0.3636

0.3610

Indx_Agree

0.7267

0.7121

0.7485

0.7452Slide33

Initial Performance Analysis of Improved System (Forecast Day 2)

SOUTHEAST: Warm Season

SOUTHEAST: Cool Season

24-H

PM2.5 for Forecast Day 2

Warm Season:

Vanilla

Warm

Season:

Assim

Cool Season: Vanilla

Cool Season:

Assim

Obs Average

9.7129

9.7129

8.3013

8.3013

Model Average

10.6028

10.8593

9.9296

9.9459

Bias

0.8899

1.1464

1.6283

1.6446

Error

4.3487

4.2299

3.8382

3.6998

RMSE

5.6151

5.4595

5.3146

5.0049

Normalized Bias

-0.1521

-0.1934

-0.2988

-0.3162

GRS_ERR

0.5247

0.5233

0.5361

0.5340

Slope

0.9632

0.9314

0.8160

0.7407

R2

0.3628

0.3653

0.2818

0.2754

Indx_Agree

0.7237

0.7277

0.6625

0.6713Slide34

Initial Performance Analysis of Improved System (Forecast Day 2)

NORTHCENTRAL: Warm Season

NORTHCENTRAL: Cool Season

24-H

PM2.5 for Forecast Day 2

Warm Season:

Vanilla

Warm

Season:

Assim

Cool Season: Vanilla

Cool Season:

Assim

Obs Average

8.7714

8.7714

7.1955

7.1955

Model Average

9.1849

9.8653

8.5960

8.9614

Bias

0.4134

1.0939

1.4005

1.7659

Error

3.9853

3.8155

3.6868

3.9190

RMSE

5.2985

5.0010

4.9846

5.2449

Normalized Bias

-0.4709

-0.5833

-0.7238

-0.8172

GRS_ERR

0.7876

0.8271

0.9505

1.0282

Slope

0.5755

0.6294

0.6484

0.6419

R2

0.2695

0.3361

0.3520

0.3322

Indx_Agree

0.7110

0.7439

0.7475

0.7294Slide35

Initial Performance Analysis of Improved System (Forecast Day 2)

SOUTHCENTRAL: Warm Season

SOUTHCENTRAL: Cool Season

24-H

PM2.5 for Forecast Day 2

Warm Season:

Vanilla

Warm

Season:

Assim

Cool Season: Vanilla

Cool Season:

Assim

Obs Average

10.6310

10.6310

7.4126

7.4126

Model Average

9.2952

10.0695

9.9050

10.2634

Bias

-1.3358

-0.5615

2.4924

2.8508

Error

4.9154

4.4921

3.8855

4.1135

RMSE

6.6775

6.1108

5.1227

5.3745

Normalized Bias

0.0009

-0.0742

-0.4953

-0.5590

GRS_ERR

0.4960

0.4726

0.6436

0.6916

Slope

0.3832

0.4623

0.7430

0.7438

R2

0.1151

0.1737

0.2899

0.2827

Indx_Agree

0.6082

0.6551

0.6530

0.6347Slide36

Initial Performance Analysis of Improved System (Forecast Day 2)

NORTHWEST: Warm Season

NORTHWEST: Cool Season

24-H

PM2.5 for Forecast Day 2

Warm Season:

Vanilla

Warm

Season:

Assim

Cool Season: Vanilla

Cool Season:

Assim

Obs Average

6.7305

6.7305

11.1984

11.1984

Model Average

8.0950

8.8811

9.6964

10.2336

Bias

1.3645

2.1506

-1.5019

-0.9648

Error

4.4840

4.7930

6.6083

6.7406

RMSE

9.0250

9.1813

9.7324

9.8392

Normalized Bias

-0.7362

-0.8978

-0.2911

-0.3567

GRS_ERR

0.9990

1.1072

0.8314

0.8663

Slope

0.2827

0.2978

0.2993

0.3163

R2

0.1160

0.1231

0.1071

0.1092

Indx_Agree

0.5293

0.5358

0.5850

0.5884Slide37

Initial Performance Analysis of Improved System (Forecast Day 2)

SOUTHWEST: Warm Season

SOUTHWEST: Cool Season

24-H

PM2.5 for

tForecast

Day 2

Warm Season:

Vanilla

Warm

Season:

Assim

Cool Season: Vanilla

Cool Season:

Assim

Obs Average

9.1381

9.1381

10.7715

10.7715

Model Average

6.8056

8.2485

8.8409

9.7346

Bias

-2.3325

-0.8896

-1.9305

-1.0368

Error

3.8942

3.6348

5.4900

5.5367

RMSE

5.4889

5.0529

9.8228

9.7368

Normalized Bias

-0.0246

-0.2239

-0.3784

-0.5082

GRS_ERR

0.5198

0.5596

0.7973

0.8563

Slope

0.2596

0.3131

0.1740

0.1836

R2

0.2288

0.2431

0.1269

0.1262

Indx_Agree

0.6061

0.6577

0.4972

0.5095

= MODIS assimilation improves

= Vanilla Model BetterSlide38

Initial Performance Analysis of Improved System (Forecast Day 2)

Summary for 24-H Average Day 2 Forecast (06z – 06z)

Region/

Season

Much

Improves

Modest

Improves

Wash

Modest DegradesMuch DegradesNE - Warm

X

NE - Cool

x

SE- Warm

x

SE- Cool

x

NC - Warm

X

NC -

Cool

X

SC - Warm

X

SC - Cool

X

NW

- Warm

x

x

NW - Cool

x

SW - Warm

X

SW

- Cool

x

xSlide39

Overview of Forecast Lead-Time Results by Region/Season

Region/

SeasonDay

0 Forecast

Day

1

Forecast

Day

2 ForecastNE - WarmB

BNE - CoolBBSE- WarmSE- CoolNC - Warm

NC -

Cool

B

B

SC - Warm

SC - Cool

B

B

NW

- Warm

B

B

B

NW - Cool

SW - Warm

SW

- Cool

= Much Improves

= Modest Improves

= Very slight improves

= Little Change

= Very slight degrade

= Modest Degrades

= Much Degrades

B

: indicates the

assimilated model

worsened

an already high biasSlide40

On the Horizon: Further improvements with the use of surface PM2.5 Observations

1)

Tau Increases but surface PM2.5 is not high enough

: preferentially increase concentrations within PBL while not nudging as much above PBL in order to better match surface PM2.5

2)

Tau Decreases but surface PM2.5 is still too high

: preferentially decrease concentrations more within PBL than above so as to better match the observed surface PM2.5

(Focus Here First)

Current Revised “Inverse Operator” only considers the situation when the final analyzed TAU increases and surface PM 2.5 is “too hot” as a result of linear concentration re-scaling in the vertical.

Three more improvements are planned in the near future, each of which will conserve the final analyzed TAU (after assimilation step):

3)

Tau Decreases but surface PM2.5 is too low

: preferentially decrease concentrations more above the PBL than within so as to better match the observed surface PM2.5

Revisions are planned to be implemented

and running by May 1, 2014Slide41

Conclusions

Initial Performance Analysis of the BAMS CMAQ-MODIS-DA analysis and forecast model for Warm and Cool Seasons by Six Sub-regions shows:

Very encouraging overall improvements, extending out to at least the 2

nd

forecast day in many regions

More consistent improvements during the warm season, when cloudiness is not as much of an issue

Impressive improvements in the SW US (all seasons) and South Central during the warm season

Some areas of concern –

NE US where vanilla performance is already very good

The Pacific NW warm season (clouds?)

Cool season in the central US (clouds?)

Analysis of regions/seasons that did degrade show that *increases* in an already high bias played a role in statistical degradation. Thus first order of business is to implement the additional vertically-sensitive improvements in the TAU-inversion step using real-time PM2.5 surface observationsSlide42

Contact Information

Web:

http://www.baronservices.com

John N. McHenry, Chief Scientist

Baron Advanced Meteorological Systems

1009 Capability Drive, Suite 312

Raleigh, NC 27606

Email:

john.mchenry@baronams.com Phone: 919-839-2344