PDF-Because supply and demand diagrams that explain how interest rates are
Author : danika-pritchard | Published Date : 2016-06-22
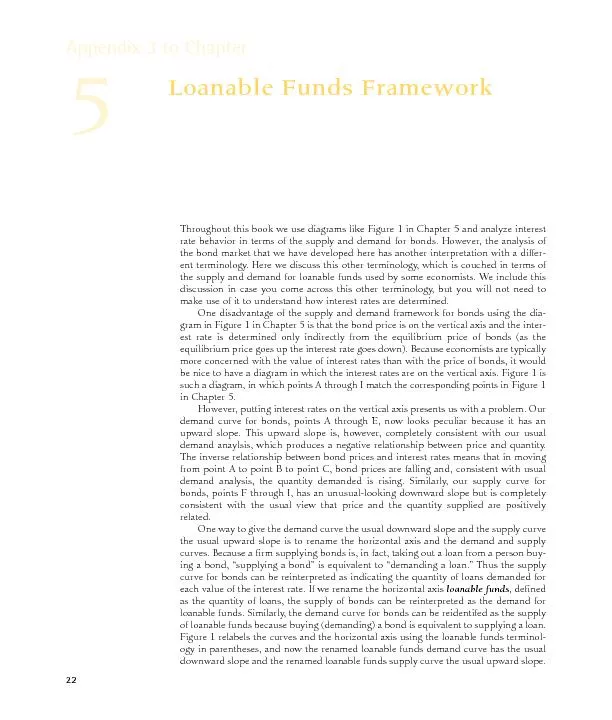
A Comparison of Terminology Loanable Funds and Supply i increases as we goup the vertical axis in contrast to Figure 1in the text in which the opposite occurs 330 100200 176 Loanable
Presentation Embed Code
Download Presentation
Download Presentation The PPT/PDF document "Because supply and demand diagrams that ..." is the property of its rightful owner. Permission is granted to download and print the materials on this website for personal, non-commercial use only, and to display it on your personal computer provided you do not modify the materials and that you retain all copyright notices contained in the materials. By downloading content from our website, you accept the terms of this agreement.
Because supply and demand diagrams that explain how interest rates are: Transcript
Download Rules Of Document
"Because supply and demand diagrams that explain how interest rates are"The content belongs to its owner. You may download and print it for personal use, without modification, and keep all copyright notices. By downloading, you agree to these terms.
Related Documents