PDF-CAN A FREAKISH EVENT IN A LONG SERIES BE BLAMED FOR APPARENT MODEL FAI
Author : danika-pritchard | Published Date : 2016-04-17
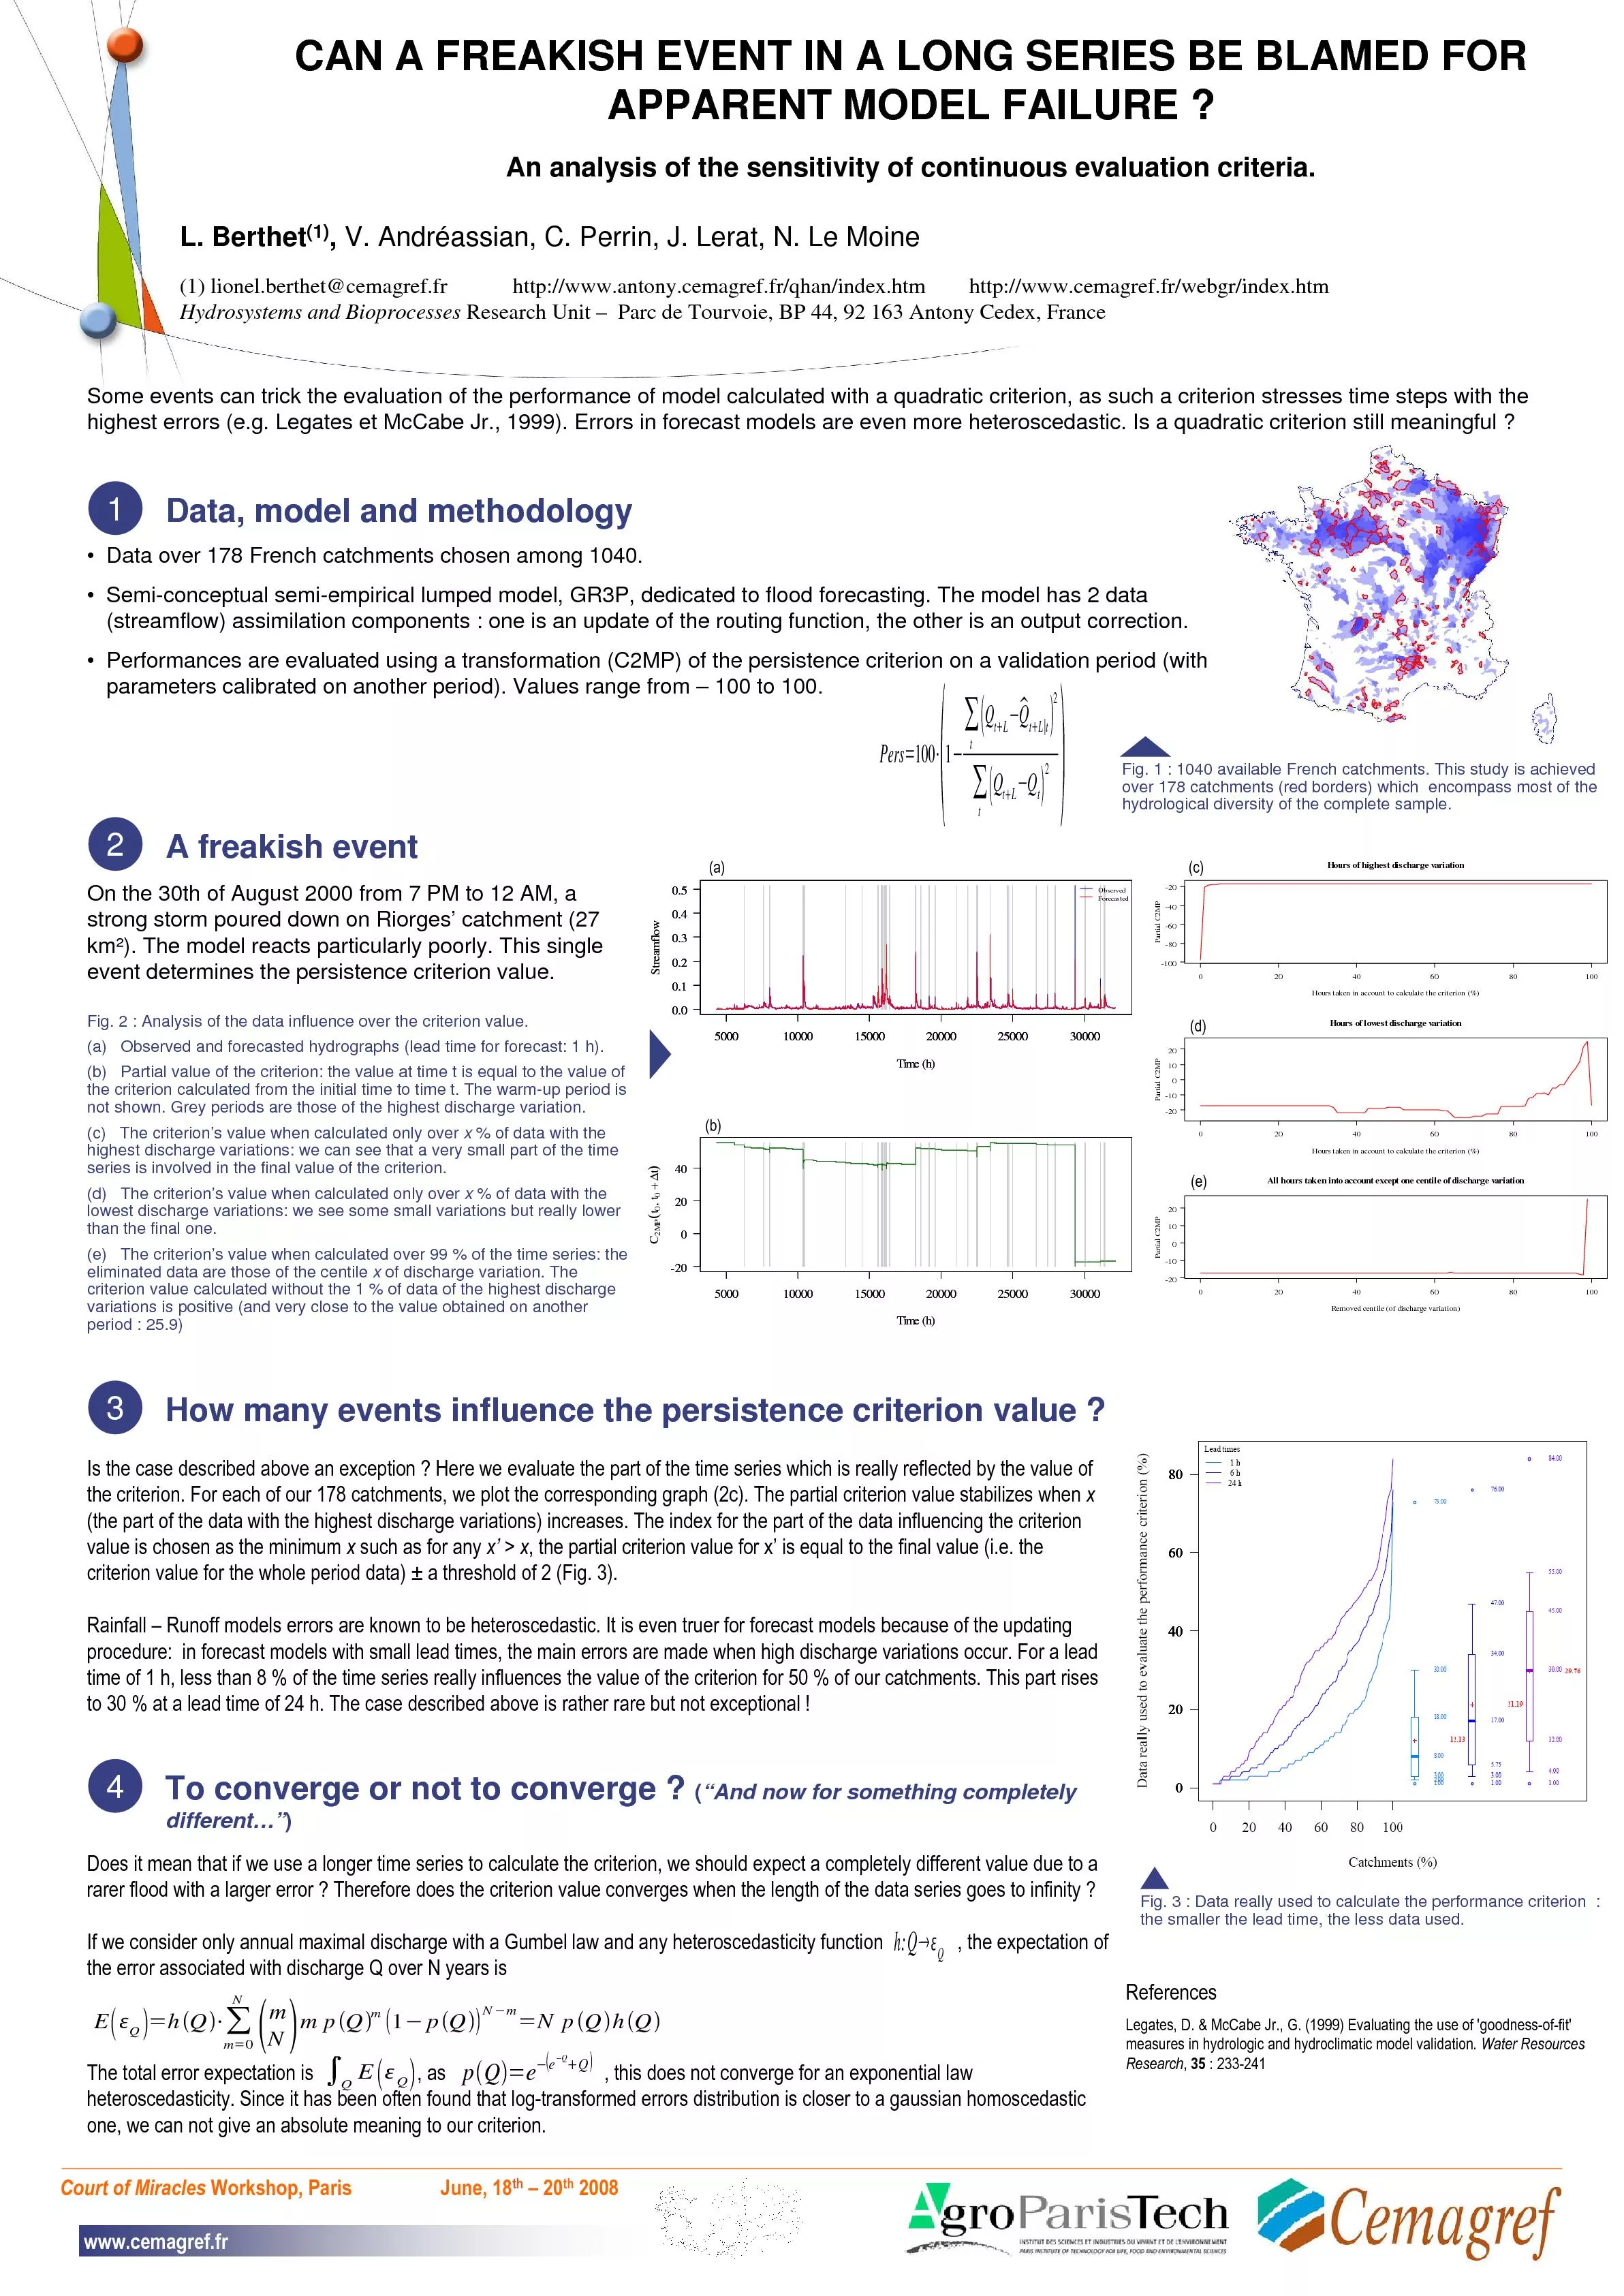
Data model and methodologyFig 1 1040 available French catchments This study is achieved over 178 catchments red borders which encompass most of the hydrological
Presentation Embed Code
Download Presentation
Download Presentation The PPT/PDF document "CAN A FREAKISH EVENT IN A LONG SERIES BE..." is the property of its rightful owner. Permission is granted to download and print the materials on this website for personal, non-commercial use only, and to display it on your personal computer provided you do not modify the materials and that you retain all copyright notices contained in the materials. By downloading content from our website, you accept the terms of this agreement.
CAN A FREAKISH EVENT IN A LONG SERIES BE BLAMED FOR APPARENT MODEL FAI: Transcript
Download Rules Of Document
"CAN A FREAKISH EVENT IN A LONG SERIES BE BLAMED FOR APPARENT MODEL FAI"The content belongs to its owner. You may download and print it for personal use, without modification, and keep all copyright notices. By downloading, you agree to these terms.
Related Documents