/
Group 1 – Interface of Chemistry and Biology Group 1 – Interface of Chemistry and Biology

Group 1 – Interface of Chemistry and Biology - PowerPoint Presentation

danika-pritchard
danika-pritchard . @danika-pritchard
Follow
402 views
Uploaded On 2017-06-02

Group 1 – Interface of Chemistry and Biology - PPT Presentation

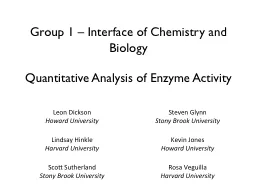
Quantitative Analysis of Enzyme A ctivity Scott Sutherland Stony Brook University Steven Glynn Stony Brook University Lindsay Hinkle Harvard University Rosa Veguilla Harvard University Leon Dickson ID: 555249

michaelis data reaction menten data michaelis menten reaction hiv plot enzyme time university max protease activity experimental substrate kinetics

Share:

Link:

Embed:

Download Presentation from below link

Download Presentation The PPT/PDF document "Group 1 – Interface of Chemistry and B..." is the property of its rightful owner. Permission is granted to download and print the materials on this web site for personal, non-commercial use only, and to display it on your personal computer provided you do not modify the materials and that you retain all copyright notices contained in the materials. By downloading content from our website, you accept the terms of this agreement.


Presentation Transcript

Slide1

Group 1 – Interface of Chemistry and BiologyQuantitative Analysis of Enzyme Activity

Scott SutherlandStony Brook University

Steven GlynnStony Brook University

Lindsay HinkleHarvard University

Rosa VeguillaHarvard University

Leon DicksonHoward University

Kevin Jones

Howard UniversitySlide2

Goals and ObjectivesLearning Goal: Students will have the ability to manipulate, interpret, and produce visual

representations of data describing kinetic properties of enzymes

Learning Objectives:Students will be able

to:Determine reaction rates from experimental time-course dataP

roduce the Michaelis-Menten plot from

experimental dataInterpret changes in reaction conditions from different

Michaelis-Menten

plots

Design

an experiment

to generate data for a

Michaelis-Menten

p

lotSlide3

Who you are:Upper level Biochemistry major who has completed Calculus and Introductory Chemistry and Biology We’re halfway through a lecture in steady-state enzyme kinetics. See tip sheet for topics you have covered.Slide4

HIV-1 protease is crucial for the replication of HIVInhibiting the activity of HIV-I protease is a strategy for combating the virus

The first step in designing an inhibitor is to understand the kinetic properties of the enzyme

(necessary for

HIV replication)Slide5

Steady-state enzyme kinetics

Assumptions of Michaelis-Menten kinetics:

The reaction is at equilibriumThe reaction is at steady-stateSlide6

Choose the components of the HIV-1 protease reaction

HIV-1 protease

Viral polypeptide

HIV-1 protease/Viral polypeptide complex

Cleaved viral polypeptidesSlide7

An enzyme’s response to substrate can be visualized using the

Michaelis-Menten

plot

Michaelis-Menten Equation

Substrate concentration (

μM

)

Initial reaction velocity (

μ

M

sec

-1

)

V

max

K

M

V

max

/2Slide8

Activity 1Match the experimental data to the corresponding line on the plot of time-course reactionsRemember that the slope of the time-course corresponds to the rate of the reaction at a given substrate concentrationSlide9

Clicker question

Using your handout, identify which time-course corresponds to an initial [S] of 25 uM?Slide10

Activity 1IUse the reaction velocities from the time-course data to construct a Michaelis-Menten plot

Use your plot to estimate

Vmax and K

M for your enzymeSlide11

K

M

V

max

[S]VoSlide12

Clicker questionA. 0– 5 μMB. 8 – 12

μMC. 40 – 50 μMD. 80 – 100 μM

What value for KM did you determine from your

Michaelis-Menten plot?Slide13

Here’s what it should look like:Slide14

Is Group1avir a possible drug candidate against HIV?(intracelluar substrate concentration is ~20 μM

)

+ Group1avir

Using enzyme kinetics to evaluate drug candidates

V

max = 96.4 μM

K

M

= 10.2

μM

-

Group1avir

V

max

= 96.4

μM

K

M

= 47.0

μMSlide15

Trends in Annual Age-Adjusted* Rate of Death

Due to HIV Infection, United States, 1987−2009

Note: For comparison with data for 1999 and later years, data for 1987−1998 were modified to account

for

ICD-10

rules instead of

ICD-9

rules.

*Standard: age distribution of 2000 US population

Saquinavir

released onto market by Roche Slide16

In the next lab session you will:Measure rates of an enzyme-catalyzed reactionUse your data to construct a

Michaelis-Menten plot

Determine values for Vmax and K

MSlide17

Let’s remind ourselves what we’ve accomplishedIn this class you:Determined a reaction rate from experimental time-course data

Produced the

Michaelis-Menten plot from experimental data and estimate the kinetic parameters

Used Michaelis-Menten plots to infer changes in enzyme activity, e.g. in the context of a human disease