/
Lamont-Doherty Earth Observatory, Palisades, New York Lynne D. Talley Lamont-Doherty Earth Observatory, Palisades, New York Lynne D. Talley

Lamont-Doherty Earth Observatory, Palisades, New York Lynne D. Talley - PDF document

danika-pritchard
danika-pritchard . @danika-pritchard
Follow
389 views
Uploaded On 2015-11-05

Lamont-Doherty Earth Observatory, Palisades, New York Lynne D. Talley - PPT Presentation

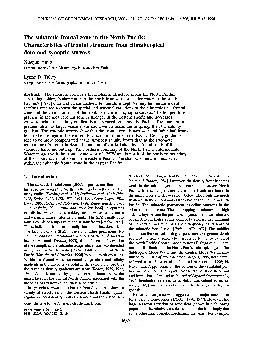
the strongest temperature fronts A horizontal minimum of Water merges with the frontal zone west of 175 ID: 183321

the strongest temperature fronts.

Share:

Link:

Embed:

Download Presentation from below link

Download Pdf The PPT/PDF document "Lamont-Doherty Earth Observatory, Palisa..." is the property of its rightful owner. Permission is granted to download and print the materials on this web site for personal, non-commercial use only, and to display it on your personal computer provided you do not modify the materials and that you retain all copyright notices contained in the materials. By downloading content from our website, you accept the terms of this agreement.


Presentation Transcript

Lamont-Doherty Earth Observatory, Palisades, New York Lynne D. Talley Scripps Institution of Oceanography, La Jolla, California Abstract. The subarctic front is a thermohaline structure across the North Pacific, separating colder, fresher water to the north from warmer, saltier water to the south. Levitus's [1982] data the strongest temperature fronts. A horizontal minimum of Water merges with the frontal zone west of 175¿W and is north of the northern boundary of the subarctic frontal zone No clear seasonal or interannual variations of the SFZ location have been found [Yoshida, ¥993], although seasonal variation of the strcngttl of the subarctic temperature front was detected in the western North Pacific [Roden, Central Mode Water, sub- mitted to Journal of Physical North Pacific: Its distribution and formation, submitted to Journal of Physical Oceanography, 1996; hereinafter referred to as Nakamura, submitted manu- script, 1996) and may also be related to the subarctic fronto- genesis. Ekman convergence was suggested as a major of the strength and location of the subarctic front across across the front, are also addressed. This paper consists of two parts. The first part concentrates on the climatological frontal zone using Levitus's [1982] tem- perature and salinity data. The detailed frontal structure and its main characteristics are then studied using 72 cross-front conductivity-temperature-depth/salinity-temperature-depth (CTD/STD) sections in the second part of the paper. Under- way data along the Levitus's data represent mean and smoothed conditions. Since frontal scales in a real ocean are usually much smaller than Levitus's and salinity fronts in Levitus's [1982] data by the maximum of horizontal temperature and salinity gradients, respectively. This definition will not be applied to synoptic surveys. In this paper the subarctic front refers to the subarctic frontal zone, and the subtropical front means the subtropical and salinity gradients is 2. (2) Horizontal temperature and salinity gradients in the west- ern, central, and eastern North Pacific are plotted in Figure 1. Despite heavy horizontal smoothing in the data and averaging over four seasons, high horizontal gradients in the subarctic frontal zone between 40¿N and 44¿N stand out significantly. The strongest annual mean subarctic temperature front is found in the western North Pacific, and the weakest front occurs in the eastern North Pacific. the eastern North Pacific the subtropical front in the eastern North Pacific. by the clear maxima of the gradients (Figure 1). Locations of maximum tempera- ture and salinity gradients are selected throughout the North Pacific at the depths of 10 and 100 m (Figure 2). The subarctic front, subtropical front, and doldrum front can be identified in both temperature and salinity fields. However, the Kuroshio front which occurs between 30 ¿ and 40¿N in the western Pacific [Mizuno and White, 1983] surprisingly is missing front splits into two parts: one turns northeast, and the other shifts southward. The subtropical temperature front starts from 20¿N in the western Pacific and extends northeastward. This front loses its identity east of 160¿W. Two large-scale identifiable but not in the same location as Roden [1974, 1975] suggested. Below the seasonal thermocline, which is few degrees of latitude south of the front at 100-m depth, which occurs at the gradient) undergoes a seasonal cycle (Figure 3a). The strongest front occurs in spring summer at this longitude. This implies that unevenly distributed surface heating in spring is important in has a relatively small variation of intensity in winter, spring, and fall. However, it disappears in summer because of stronger and more uniformly distributed surface heating. The subarctic salinity front has a very small annual variation in both location and intensity in the central North Pacific, as does the subarc- tic front are listed in Table 1. The variability of temperature at the temperature front is the strongest in the central Pacific: 10.44¿C. The variation of temperature at the front exceeds 7¿C in both the eastern and western Pacific. These variations are 5-10 times larger than the maximum temperature change across 100 km in the frontal zone. The salinity at the subarctic salinity front has an annual range of 0.23%0 in both the west- ern and central Pacific. This variation is comparable to the maximum salinity change across 100 km in the frontal zone. In the eastern Pacific the variation is double. It is worth mentioning that the apparently annual motions of the climatological subarctic temperature and salinity fronts are not the movements of isotherms and isohalines. The maxima temperature and salinity gradients occur at different isotherms and isohalines in different seasons (Table 1). For example, the subarctic temperature appears to migrate to the vulnerable to the surface forcing during summer since the seasonal thermocline is at a depth of about 30 m in the in differ- ent seasons and at different depths. 2.3. Stability Gap in Winter The subarctic ocean is characterized by a permanent halo- cline between 100 and 150 m in winter and a seasonal thermo- cline between 30 and at the Subarctic Temperature Front and Salinity at the Subarctic Salinity Front in the Western (165¿E), Central (170¿W), and Eastern (140¿W) North Pacific (NP) in Levitus's [1982] Data and salinity fronts are defined by the maximum horizontal temperature and salinity gradient, respectively. which outcrops in the subarctic frontal zone. We use the The winter stability gap the minimum is found near 30¿N. The minima suggest lower stability these areas. Especially in the south- ern boundary, a merging of a shallow stable layer south of the less stable areas soars the depth from 300 to 100 m in a very short distance. Reid [1982] used the sudden change in mixed layer depth could cause a convergence of Ekman veloc- ity without a convergence of Ekman transport. 2.4. Density I,,,,I,,,,I,,, ,I, ,, I,,,, I, o 100 - 200- 4 400- 500 ,A ,,,,I,,,,I .... I .... I , , , , I , , , , I However, R p cannot distinguish among regions where both a OT and 130S are positive from those where both are negative. Also, when the salinity gradient becomes The shaded areas show where the contribution of the salinity gradient to the to 65¿N in Figure 7. Tempera- ture gradients are stronger (Turner an- gles climatological frontal zone. Closely -135 ¿ -180 ¿ .90 o. I temperature gradient F" 1 dominant 135 ¿ -45¥ A s I 1 90 ¿ 0 o 45 ¿ Figure 6. The plane -A r = - OtOyT versus As = [30yS. Lines of constant R p radiate outward at a constant angle from the western (165¿E), central (175¿W), and eastern (140¿E) North Pacific, respectively. Shaded areas show where salinity gradients dominate. Tem- perature gradients dominate in unshaded [Roden, 1972, 1977; Lynn, 1986]. A few sharp individual temperature and salinity fronts can of the strength, location, and width of the synoptic subarctic frontal zone are addressed. Mixed layer depth variations and the ex- tent of density compensation are also 40 ¿ 20 ¿ oi 160¿E 180 ¿ 140 ¿ 100¿W Figure 8. Map of conductivity-temperature-depth/salinity-temperature-depth (CTD/STD) stations used in section 3. In total, there are 3880 stations and 72 cross-front sections from 36 research cruises occupied between 1968 and 1993. Pacific from 1968 to 1993 (Figure 8). The sources of the data are listed in Table 2. They include the surveys from the World Ocean Circulation Experiment (WOCE), International North Pacific Ocean Climate sections were taken in these cruises. The data, however, are distributed unevenly in both space and time. There are more observations along 170¿E, 175.5¿E, and 180 ¿ than any other longitude be- cause Japanese scientists conducted the 12 years of repeated surveys along these meridians. Relatively dense surveys are also found between 160¿W and 150¿W in the eastern Pacific. No observations were made in January. One section was taken each in February, March, and in June and July, when the Japanese repeated surveys occur. Most station depths are 1500 m surveys varies from 37 to 83 km. The spacing can be as close as 20 km or as far apart as 333 km in the subarctic frontal zone. 3.2. Definition of the Subarctic Front in CTD/STD Sections In section 2.2 it outcrop of the 33.8%0 isohaline is usually found in one of these fronts (often the southernmost WOCE 4 March 1991, R/V Discoverer, June 1991, R/V Washington, August 1992, R/V Vickers, May 1993 R/V Thompson INPOC 6 February 1991, Priliv, September 1991, I ........ I ....... o 100 - 200 300 400 ¥-¥ 34.0 1¥00 ' ¥ 2000 3¥km 25 ¿ 3 o 3 o 40 ¿ 45 ¿ 50 ¿ 5OO 0km B i i i ! i ! I i i i i i .... i , , , fronts are not time dependence. This agrees with Yoshida's [1993] satellite observations of the temperature gradient in the western North Pacific. structure are found in the CTD/STD data. We define a type 1 structure to be a frontal zone consisting an example of this type. The type 2 frontal zone is found on 28 sections without any longitudinal preference. There are more than two individual fronts in our type 3 frontal structure, two of which usually appear frequently found in the eastern North Pacific. The width of the subarctic frontal zone defined by salinity structure varies from 400 km 800 200 _A i 140¿E + + with an origin of the subarctic front as the Oyashio front in the western North Pacific which is then advected across the Pacific; the frontal zone will be dispersed and weakened no clear pattern (Figure July each year. These variations may be a interannual variation. They are the Frontal Zone Temperature and salinity for the 72 CTD/STD sections were objectively mapped in the upper 1000 m the maxima indicates the lated from zonally averaged SST and then smoothed with a 4-week running average. The resulting maximum temperature gradient varies close to white noise. Un- even sampling of the data in time might cause this. However, Kazmin and Rienecker subarctic front in the central North Pacific. station spacing is 66 km. An individual oceanic front is expected to have a length scale much smaller than this station spacing. We also should bear in A I I I I ¥ I 02 0.4 0.6 SA!INITYGRADIENr (l:0t/l¥) Figure 13. B I I I I I I "I 02 0.4 0.6 ¥ 'TEM:¥E¥TUREGRADIENr (¥._./1¥) (a) Maximum salinity and (b) maximum temper- ature gradients in the subarctic frontal zone as functions of the station spacing near the frontal zone for each of the CTD/STD surveys. The mean station spacing over the 72 sections is 66 km. averaged every minute. near 180 km is within the subarctic frontal zone derived from the CTD station data. The true front as seen in the underway data has a temperature contrast of 0.94¿C and a width of 8 km. This frontal strength is equivalent of 19 LU 18 ¥ ¥7 150 station spacing strongly influences the horizontal maximum gradients of tracers. Figure 13 shows the relationship between 48 .¥ ¥s frontal strengths. Fortunately, the station spacings do not have ¥ an eastward increasing trend. Therefore the eastward decreas- ing trend in the maximum temperature gradient is probably accurate. 15 Surface temperatures were collected continuously along the WOCE P17 section, which is one of our 36 CTD/STD cruises. The cruise occupied the southern part of the subarctic frontal zone along 135¿W. The southern boundary of the frontal zone is located at 33.57¿N from the CTD section. A temperature probe was mounted on the ship at an inlet within the subarctic frontal zone defined by salinity structure from The sections were along 152¿W, 158¿W, 160¿W, 168¿W, is established in both the subtropical and subarctic gyres from June to De- cember basinwide. The are used to examine the mixed layer depth across the front. Eight of them have southward mixed layer deepening over 100 m within the frontal zone. The mixed layer deepens south- ward immediately south of the southern boundary of the opposite direction. Thus Ekman pumping cannot generate this northward deepening either. What causes the outcrop of the subarctic halocline is not fully understood yet. Yuan and Talley [1992] showed that long- term mean zero Ekman pumping crosses in section 2.3 the mixed layer depth can reach to more than 200 m in the stability gap. The deepening is especially fast at the boundary of the gap. In recent studies, Nakamura (submitted manuscript, 1996) and Suga et al. (submitted manuscript, 1996) suggested that the North Pacific Central Mode Water is formed in this stability gap due to deeper winter convection and advected away from its formation area by g¥neral circula- tion. Our data suggest that the subarctic frontal zone can serve as the northern limit of the formation area of this Central Mode Water. Bear in mind, this mixed layer deepening can cause a ü -0.02 -0.03 - -0.04 - -0.05 - -0.06 - -0.07 - in the Frontal Zone Weak density gradients and strong, compensated tempera- ture and aOyT and mean 13OyS are compared with mean The largest density gradient is found along 165¿E, which was taken in August 1992. The two other surveys along the same longitude were taken in November 1983 and October 1984 and show relatively small density gradients. The synoptic observa- tions along 165¿E are consistent with Levitus's [1982] data in the aspect of less density compensation during summer months (Figure 7B). Mean Turner angle in the frontal zone averaged over 63 sections is 78.3 ¿, with a standard deviation of 11.1 ¿. The mean Turner angle falls in temperature-dominated regime (see Fig- ure 6). This mean Turner angle is equivalent to a density ratio of 2.08 which is about the mean density ratio in the midlatitude North Pacific (about 30 to 50¿N) [Stommel, 1993; Chen, 1995]. In general, the subarctic frontal zone is partially density com- pensated. Figure 17 shows Turner angles along 72 sections. Even though the CTD/STD temperature and salinity are smoothed with a Gaussian filter of 2 ¿ latitude width, the Turner angles are still much noisier than the those calculated from Levitus's [1982] data (Figure 7). The Turner angles cluster between weaker than at the fronts. The weak salinity gradients can generate ..... '"' '- The northern boundary of the North Pacific Intermediate Water (circles) relative to the northern (triangles) and southern (crosses) boundaries of the subarctic frontal zone. (b) The northern onset of the shallow salinity minimum (circles) relative to the southern (crosses) and northern (triangles) boundaries of the subarctic frontal zone. 3.8. The Subarctic Front Relative to the NPIW and SSM The North Pacific Intermediate Water (NPIW), indicated by a well-defined, thick, and smooth salinity minimum, occurs in the density range of 26.7 to 26.9 rr 0 throughout the subtropics [Reid, 1965; Talley, 1993]. The NPIW centers around a depth from 500 to 700 m in the subtropical gyre. The presence of the NPIW characterizes the subtropical water. On 50¿N [Reid, 1973; Tsuchiya, 1982; Yuan and Talley, 1992]. The potential the SSM. 3.9. Differences Between the Western and Eastern North Pacific Differences exist in the subarctic front between the western and eastern North Pacific in both climatological data and the synoptic surveys. The climatological 3 frontal structure which 165¿E (including 165¿E), the salinity front can penetrate down from 350 on its approximately 6000 km journey and horizontal variation of the Ekman pumping are the in winter. Frontogenesis due to the meridional variability of Ekman pumping (from wind stress and Levitus's data) also has a mechanisms during summer. Different processes have to be considered for other seasons. Unevenly distributed turbulent flux is another frontogenetic mechanism. In a following paper a wind stress analysis will show that the energy at synoptic timescales haS a high meridional gradient across the subarctic front especially in the western North Pa- cific. Roden [1977] parameterized convective turbulent fluxes and showed that they cause frontolysis in the subarctic frontal area. However, other forms of turbulent mixing, such as wind stirring in the mixed layer and entrainment at the base of the mixed layer, The most important factor in forming the subarctic front is the outcrop of the subarctic permanent halocline. This outcrop is so prominent that we use the outcrops to define the frontal zone. In the western North Pacific the salty water from the Kuroshio meets the fresh Oyashio water in the mixed water region, creating a high surface salinity gradient. A strong tem- perature contrast is also created by the northward moving warm salinity front is not weakened eastward. In the synoptic sections the strongest individual salinity fronts weaken less toward the east than the strongest temperature fronts. This implies that salinity frontogenesis is relatively stronger than temperature frontogenesis in the eastern North Pacific. As we know the lowest surface salinity is found in the eastern subpo- lar gyre due to excess runoff and precipitation there. This may cause the meridional salinity gradient across the gyre boundary to be stronger in the eastern Pacific than in the western Pacific. In the eastern Pacific, both the Ekman advection and geostro- phic flow contribute to transport the surface subarctic water into the subtropical gyre, where it meets the high-salinity sub- tropical surface water. This enhances the subarctic salinity front. On the other hand, the meridional temperature gradient across the gyre boundary is weaker in the eastern Pacific than in the western Pacific. The same amount of subarctic surface water flushed into the subtropical gyre will create less temper- ature gradient than salinity gradient. So the eastern Pacific (Figure 7). The stronger salinity front gen- erates a small density gradient in the frontal zone even though the frontal zone occurs in the temperature-dominated regime (Figure 7). That explains why the subarctic front is in the temperature-dominated regime yet is still density compensat- ing in the eastern Pacific. 5. Summary The analysis in summarized as following. The subarctic frontal zone front splits into two branches in the eastern Pacific. One branch turns northward to the existence of the strong salinity front. The low-salinity subarctic water is flushed into the subtropical gyre in the upper ocean and meets the high-salinity subtropical surface water in the eastern Pacific, which enhances the salinity front in the as follows. The subarctic frontal zone in CTD/STD sections is well defined by its equivalent to or larger than the annual migration of the frontal location shown in the Levitus's [1982] data. Temporal all synoptic, seasonal and interannual variations which cannot be distinguished based upon synoptic data largely occurs at the transition area between gyres. Temperature gradients dominate to the south in the subtropical gyre, while salinity the strongest temperature fronts (2.10) is very close to the background density ratio in the midlatitudes (30 ¿ to 50¿N). The mixed layer deepens subarctic frontal zone. The subarctic frontal zone limits North Pacific by the general circulation. Horizontal mixing and diffusivity tend to disperse and weaken the frontal zone on response of the Pacific Ocean subarctic front to momentum transfer: A Hirano, Review of oceanography Pap., 13, 149 pp., 1982. Lynn, R. J., The subarctic and northern subtropical fronts in the eastern North Pacific ocean in spring, J. Phys. Oceanogr., 16, 209- 222, 1986. Martin, M., L. D. Talley, and R. A. de Szoeke, Physical, chemical and in the Kuroshio current system, J. Phys. Oceanogr., 13, 1847-1867, 1983. Reid, J. L., Intermediate waters of zone in the western Pacific, J. Geo- phys. Res., 77, 7175-7187, 1972. Roden, G.I., Thermohaline structure, fronts, and sea-air energy ex- change of the trade wind region east of Hawaii, J. Phys. Oceanogr., 4, 168-182, 1974. Roden, G.I., On the North Pacific temperature, salinity, sound veloc- ity and density fronts and their relation to the wind and energy flux fields, J. Phys. Oceanogr., 5, 557-571, 1975. Roden, G.I., Oceanic subarctic fronts of the central North Pacific: Structure of and response to atmospheric forcing, J. Phys. Oceanogr., 7, 761-778, 1977. Roden, 68 pp., 1988. Ruddick, B., A practical indicator of the stability of the water column to double-diffusive activity, Deep Sea Res., Part A, 30, 1105-1107, 1983. Samelson, R. M., and C. A. Paulson, Towed thermistor chain obser- vations of fronts in the subtropical North Pacific, J. Geophys. Palisades, NY 10964-8000. (e-mail: yuan@ldgo.columbia.edu) (Received September 25,