/
Oxford University Press, 1937 THE OBSERVATIONAL APPROACH TO COSMOLOGYB Oxford University Press, 1937 THE OBSERVATIONAL APPROACH TO COSMOLOGYB

Oxford University Press, 1937 THE OBSERVATIONAL APPROACH TO COSMOLOGYB - PDF document

danika-pritchard
danika-pritchard . @danika-pritchard
Follow
394 views
Uploaded On 2016-11-08

Oxford University Press, 1937 THE OBSERVATIONAL APPROACH TO COSMOLOGYB - PPT Presentation

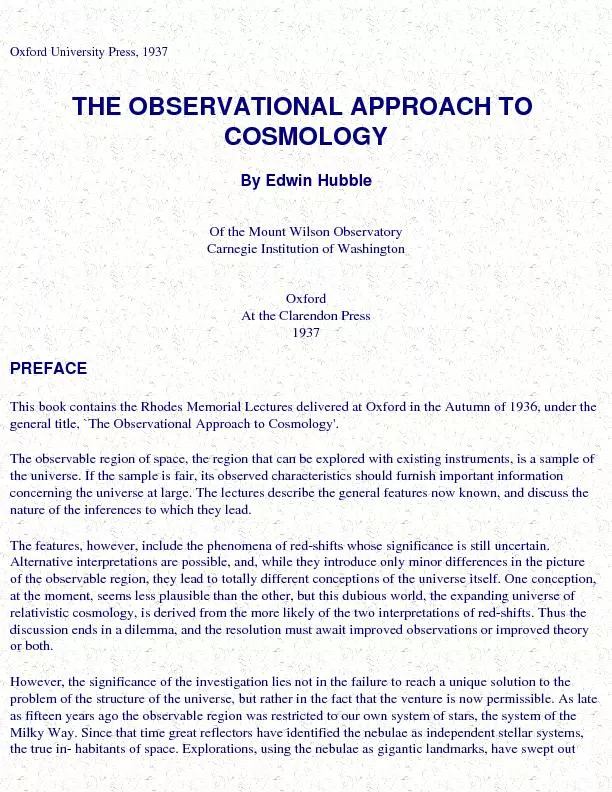
beyond the Milky Way to the very limits of existing telescopes The observable region our sample of the universe has been suddenly magnified a million million fold Now for the first time the samp ID: 486209

beyond the Milky Way

Share:

Link:

Embed:

Download Presentation from below link

Download Pdf The PPT/PDF document "Oxford University Press, 1937 THE OBSERV..." is the property of its rightful owner. Permission is granted to download and print the materials on this web site for personal, non-commercial use only, and to display it on your personal computer provided you do not modify the materials and that you retain all copyright notices contained in the materials. By downloading content from our website, you accept the terms of this agreement.


Presentation Transcript

Oxford University Press, 1937 THE OBSERVATIONAL APPROACH TO COSMOLOGYBy Edwin HubbleOf the Mount Wilson Observatory Carnegie Institution of Washington Oxford At the Clarendon Press 1937 PREFACEThis book contains the Rhodes Memorial Lectures delivered at Oxford in the Autumn of 1936, under the general title, `The Observational Approach to Cosmology'. The observable region of space, the region that can be explored with existing instruments, is a sample of the universe. If the sample is fair, its observed characteristics should furnish important information The features, however, include the phenomena of red-shifts whose significance is still uncertain. Alternative interpretations are possible, and, while they introduce only minor differences in the picture of the observable region, they lead to totally different conceptions of the universe itself. One conception, discussion ends in a dilemma, and the resolution must await improved observations or improved theory or both. However, the significance of the investigation lies not in the failure to reach a unique solution to the problem of the structure of the universe, but rather in the fact that the venture is now permissible. As late beyond the Milky Way to the very limits of existing telescopes. The observable region, our sample of the universe, has been suddenly magnified a million million fold. Now, for the first time, the sample The break through into extra-galactic space and the preliminary reconnaissance of the observable region have been described in The Realm of the Nebulae, recently published by the Yale University Press. The The Realm of the Nebulae. Although the subject is developed from the observers' point of view, it is necessarily permeated with cosmological theory. Fortunately, the writer has had the privilege of association with Richard C. Tolman The illustrations reproduce photographs made with the telescope chiefly responsible for the recent development of the field of nebular research, namely, the 100-inch reflector of the Mount Wilson Table of Contents I. THE OBSERVABLE REGION AS A SAMPLE OF THE UNIVERSE The Observational Approach to Cosmology The Copernican Revolution The Theory of Island Universes Nebulae as Island Universes Family Characteristics of Nebulae Criteria of Nebular Distances The Average Nebula Distribution of Nebulae over the Sky Distribution of Nebulae in Depth The Observable Region as a Sample of the Universe II. THE ROLE OF THE RED-SHIFTS Spectrum Analysis Red-shifts Possible Interpretations of Red-Shifts Red-Shifts as Velocity-Shifts Red-Shifts as Loss of Energy in Transit The Critical Test between Alternative Interpretations The Indirect Test Effects of Red-Shifts on Apparent Luminosity The Energy Effect The Recession Factor The Alternative Laws of Red-Shifts The Dilemma III. POSSIBLE WORLDS Surveys of Nebulae The Law of Nebular Distribution when Red-Shifts are not interpreted as Velocity- Shifts The Problem of Distribution in an Expanding Universe Expanding Universes of General Relativity Comparison of Observations with Theory Spatial Curvature The Permissible Type of an Expanding Universe Conclusion SUMMARY OF OBSERVATIONAL RESULTS INDEXLIST OF ILLUSTRATIONS PLATE I Messier 51PLATES I. Messier 51 sense, to a double star. N.G.C. 5194 is a typical, late type, open spiral, while 5195 has a nondescript, The pair is so near that a few of the brightest (super-giant) stars can be seen in the spiral. These stars determine the distance-about two million light-years. As nebulae are observed at greater and ever greater distances, the stars are soon lost and, eventually, the structures fade until, at the extreme limits of the telescope, the great stellar systems appear on the II. Nebulae in the Virgo Cluster III. The Coma Cluster IV. The Corona Borealis Cluster VI. Remote Clusters VII. A Sample of the Universe DIAGRAMS 1. The Linear Law of Red-Shifts not interpreted as Velocity-Shifts CHAPTER I THE OBSERVABLE REGION AS A SAMPLE OF THE UNIVERSEThe Observational Approach to Cosmology THIS series of lectures concerns the observational approach to cosmology, to the study of the physical universe. From our home on the earth we look out into the dim distance, back into the dim past, and we Cosmology lay for ages in the realm of sheer speculation, Rational arguments were introduced slowly until the critical period just two decades ago. Then theory invaded the field in force, and rapidly Very recently, the reconnaissance has been followed by accurate surveys that extend out to the practical limits of the largest telescope in operation. Further significant extensions are not expected until more nature. The Copernican Revolution The universe of the Greeks was a small sphere. The centre was the earth; the boundary, the thin shell of the fixed stars. Between, lay the orbits of the sun, the moon, and the planets. The whole heavens, it was The Greek conception of a small, closed universe was accepted almost without question until the Copernican revolution. Copernicus not only transferred the centre of the planetary system from the earth Thus Copernicus removed the necessity for a small-scale universe, and for a thin boundary shell of stars as well. He was primarily concerned with the planets and did not himself take the logical step of Definite observational evidence to guide the choice was slow to materialize. Nevertheless, the larger universe, with all its significance, was adopted quite early, on the grounds of simplicity and uniformity. The Theory of Island Universes The first notions of the scale of stellar distances in the new universe were derived by Newton and by Huygens, using the principle of the uniformity of nature. If the sun were a star, they argued, it would be luminosity, the same candle-power, as the sun. The assumption is now known to be only a very rough approximation to the truth. Nevertheless, it justified the estimation of the general orders of distances These estimates are only a few per cent. of the true distances, but they gave the first intimation of the immense scale on which the stars are scattered. Speculation could now orient its flight, and soon a still Wright carried his speculations still farther. The notion of a single stellar system, alone in the universe, was unwelcome to his sense of proportion. He dreamed of a universe populated by countless similar Five years later Kant developed. these speculations in a form which was immediately accepted, and which persisted unchanged until recent years. Eventually, the conception was called the theory of island Observations followed as rapidly as instruments and technique developed, and, step by. step, they tended to confirm this particular line of speculation. Sir William Herschel sketched the rough outlines of our Thus the second great chapter in the exploration of space was developed. The first had been confined to the realm of the planets; the second ranged through the realm of the stars. And now, in our day, the third the nebulae. Nebulae as Island Universes The break through was an achievement of great telescopes and especially of the greatest of them all, the loo-inch reflector on Mount Wilson. The story is briefly as follows. Nebulae have long been known as Study of the nebulae revealed two quite different types. The one consists of clouds of dust and gas illuminated by neighbouring stars. These object's, numbering a few scores in all, are members of our The other type of nebulae consists of the regular, symmetrical bodies, many of them showing a spiral structure, -found by the thousands everywhere in the sky except in the Milky Way itself. Positive The conspicuous neighbouring systems were so near that, with the 100-inch reflector, many of their brightest stars could be photographed individually. Among these stars, various types were recognized Once the flood-gates were opened a wave of exploration surged forward. Already there were large accumulations of data which awaited only the essential clue, the scale of nebular distances, for their The new investigations followed two lines. In the first place, the more conspicuous nebulae were studied individually in order to determine their structure and contents, to discover their common features, and to series of accurate surveys. These lectures concern the last stage of the investigations but, in order to clarify the significance of the final results, it will be convenient to summarize the reports of the Family Characteristics of Nebulae The nebulae were found to be members of a single. homogeneous family. They are all of the same general order of intrinsic luminosity (or candle-power), and they exhibit a common pattern of rotational It is possible that the sequence represents the life-history of nebulae. The observations alone are not decisive, but they follow with remarkable fidelity the course indicated-by the theory of evolution The life-history of nebulae is a question for future investigation. For the present we are concerned with the sequence as evidence of a family relationship which permits all the nebulae to be reduced to a This fact greatly simplifies the interpretation of data from surveys. The intrinsic luminosities of nebulae are so alike that, where large members are concerned, they can often be treated, for statistical purposes, PLATE II a. N.G.C. 4501. Messier 88. b. N.G.C. 4486. Messier 87 A cluster, since it is a sample collection of many nebulae, all at the same extreme outer regions of the nebula. Messier 88 (N.G.C. 4501) is an open Criteria of Nebular Distances Since a reliable scale of distance is of vital importance in the exploration of space, the simple principles on which the scale was established will be discussed at some length. If the intrinsic luminosity (or Fundamental distances are derived from certain easily recognized types of giant stars whose intrinsic luminosities are well known from investigations within the galactic system. These stars, among which A study of the sample collection furnished by Cepheid variables demonstrated that the very brightest stars in the different nebulae are about equally luminous. They average about 50,000 times as bright as Analysis of this second collection leads to a third criterion of distance, namely, the total luminosities of the nebulae themselves. The nebulae average about 1,700 times brighter than their brightest stars - in Total luminosities form the general criterion which, in a statistical sense, applies to all the millions of nebulae that can be recorded with existing telescopes. Two additional criteria should be mentioned, because, although their application is limited, they furnish individual distances of nebulae in which stars cannot be detected. One is the law of red-shifts which, as will be explained later, are displacements of spectral lines towards the red from their normal positions. Finally, there are the brightest nebulae in clusters. Some twenty or more great clusters of nebulae are known, each containing several hundred individual members. They are remarkably similar. We find The clusters are so similar that the mean luminosity of, say, the ten brightest members, or even the individual luminosity of, say, the fifth brightest nebulae, forms a precise and convenient measure of The step-by-step development of distance criteria is rather impressive. We start with familiar methods, currently used for investigations within the galactic system, and assemble a small sample collection of The greatest uncertainty lies in the second step. The brightest stars are a certain number of times brighter than the Cepheids in the particular nebulae which form the first sample collection; but the collection is PLATE III. THE COMA CLUSTER The great clusters are the most remote objects to which individual distances In the Coma cluster the fifth nebula appears about 2,000 times fainter than d / = 0.245, corresponding with a velocity of The cluster consists of perhaps a thousand nebulae scattered over several The Average Nebula The scale of distance, as previously mentioned, is the essential clue to the. interpretation of explorations in the realm of the nebulae. The significance of surveys, for instance, depends upon the characteristics of Surveys, in general, deal with nebulae so distant that practically all their characteristics are lost from view except their total luminosities. The surviving characteristic assumes unusual importance, and In either case - nebulae in a given volume of space or nebulae of a given apparent faintness - the percentage deviations from the mean luminosity are scattered at random, and the numerical value of the These examples illustrate one of the advantages of statistical methods which deal with large numbers of individual objects. Accidental errors, random deviations from normal, tend to cancel out. The major source of uncertainty in the results arises from the possibility of systematic errors. In the surveys, for Distribution of Nebulae over the Sky Now let us consider the surveys. The nebulae are great beacons scattered through space. We know something about their nature, and, in particular, we know their intrinsic luminosities. Therefore, we can The distribution over the sky is examined by comparing the numbers of nebulae per unit area which are brighter than a particular limit of apparent faintness. In principle the method is simple and direct, but The results of such surveys indicate that the apparent distribution over. the sky is not uniform. Nebulae are not found along he heart of the Milky Way, and they are scarce along the borders. Beyond this zone The departures from uniformity in the apparent distribution follow a familiar pattern, namely, that due to local obscuration, to the absorption of light within the galactic system. From our position within the In addition to the scattered clouds, the main body of the galactic system seems to be embedded in a very tenuous medium which appears to be fairly uniform. Whatever its actual structure may be, the medium plane, towards the galactic poles. In these two directions the absorption by the medium is least - about 25 per cent. - and the nebulae are most numerous. As the line of sight departs from either pole and latitude effect is similar to the fading of the sun as it drops from The apparent distribution over the sky must evidently be corrected for local obscuration before the true distribution is revealed. Absorption by the tenuous uniform layer is readily corrected; the latitude effect Outside the zone of avoidance, the large-scale, true distribution is thoroughly uniform. The two galactic hemispheres are closely alike, and there are no systematic variations in either latitude or longitude. The Minor irregularities do exist. Nebulae are found singly, in pairs, triplets, and groups of various sizes up to the occasional great clusters. Our own nebula, the galactic system, is the chief component of a triple Distribution of Nebulae in Depth corrected and the limits have been carefully determined. Each survey can be specified in numerical m, there are, on the average, a Nm. This method of describing the data leads to the second problem of nebular distribution, namely, the Nm. The symbol may be interpreted in various, equivalent ways, because the limiting faintness, m, represents a specific distance and a N = V × constant, we know that the distribution of nebulae in depth is uniform. If the factor of proportionality is not constant, we know that the distribution departs from uniformity, and the departures become very significant features of our sample. The first counts were made hurriedly - a rapid reconnaissance for the purpose of planning the accurate surveys that followed. The result of the surveys will be discussed later, after certain corrections required The Observable Region as a Sample of the Universe The homogeneity indicated by the reconnaissance, even as a rough approximation, is very significant. The uniform distribution extends out to the limits of our telescopes. There is no trace of a physical This proposition could not be formulated before the reconnaissance was completed. As long as our positive information was restricted to the stellar system alone, the observable region then available could The picture suggested by the reconnaissance is a sphere, centred on the observer, about 1,000 million light-years in diameter, throughout which are scattered about 100 million nebulae. The nebulae average We know further that the average mass of the nebulae is about 1,000 million times the mass of the sun, and, consequently, we can assign a numerical value to the smoothed-out density of nebular material in space. The value, between 10-29 and 10-30 grammes per cubic centimetre, is evidently a lower limit to the mean density in the observable region because it ignores matter that may lie between the nebulae. The fact that we have not been able to detect any matter in inter-nebular space does not necessarily The important features of the observable region, considered as a sample of the universe, are: first, the approximate homogeneity; secondly, the general order of the mean density; and, thirdly, an additional The uniform distribution of nebulae and the linear law of red-shifts suggest that our sample of the universe is too small to indicate its nature. When we consider regions beyond the limits of our PLATE IV. THE CORONA BOREALIS CLUSTER The Corona Borealis cluster is almost a replica of the Coma cluster, but, being d / = 0.0707, corresponding with a velocity of There is, however, another way in which possible variations may be sought. The preliminary results To anticipate, the investigations lead to alternative pictures, depending upon the alternative possible interpretations of red-shifts. If red-shifts are the familiar velocity-shifts, systematic variations do exist in CHAPTER II THE ROLE OF THE RED-SHIFTSTHE previous lecture discussed the nature of the nebulae, their intrinsic luminosities and their apparent apparent However, the apparent distribution is not the true distribution. Distances are estimated on the basis of the simple law of inverse-squares. Of two equally luminous bodies, if one appears four times fainter One other factor remains to be considered. This factor - red-shifts in nebular spectra - quite definitely affects the apparent luminosities of the nebulae, and in a very conspicuous manner. The apparent Spectrum Analysis The eye rather crudely distinguishes the different wavelengths as colours - long waves are red, and short The sequence never varies. From the long waves of the red, the wave-lengths steadily diminish to the short waves of the violet. The spectrum may be long or short, depending on the apparatus, but the of the particular light in question; relative brightness at the position indicates the relative abundance of the particular wave-lengths in the composite radiation. Therefore, a spectrum furnishes valuable For instance, an incandescent solid, such as an electric light filament, radiates all possible colours; the spectrum is continuous from red to violet, and beyond in either direction. The relative abundance of the Again, an incandescent gas, such as a neon sign, radiates only certain particular colours. The spectrum, known as an emission spectrum, is a pattern of isolated colours separated by dark gaps. The pattern is There is still a third type of spectrum, and it is of especial interest for our immediate purpose. When an incandescent solid, or equivalent source, giving a continuous spectrum, is surrounded - by a cooler gas - The result is called an absorption spectrum. It presents a fairly continuous background, interrupted by dark gaps or lines which represent the colours absorbed by the superimposed gas. The distribution of Absorption lines in the spectrum of the sun indicate the presence of many or most of the elements known in the laboratory. Lines due to metal vapours are predominant, the most conspicuous being a H and K lines. Other conspicuous lines are Now the spectra of nebulae are very similar to the spectrum of the sun., Stellar systems, it appears, are dominated by yellow dwarf stars like the sun. The nebulae in general are so faint that their light can be H and K lines of calcium Red-shifts one remarkable difference. The lines in the nebular spectra, in general, are not in their normal positions; red-shifts. They are characteristic stellar system. Each line in a given spectrum is shifted by a certain constant fraction of its normal wave-length . The linear shifts vary with, the wave-lengths, but the fractional shift, d / , remains constant. Therefore, the red-shift in a particular nebula is specified by d / , and it is d / which varies from nebula to nebula. The study of many nebulae has shown that, on the average, the red-shifts increase with the apparent faintness of the nebulae in which they are measured. Therefore, we conclude that, on the average, red- This relation is called the law of red-shifts. Possible Interpretations of Red-Shifts When first observed the red-shifts were immediately attributed to radial motion away from the observer, to recession of the nebulae. This interpretation still remains the only permissible explanation that is ad hoc explanation Most of the theoretical investigators adopt this point of view, and accept without question the interpretation of red-shifts as velocity-shifts. They are fully justified in their position until evidence to In view of this possible conflict, whether of facts or theories or speculations, the observer is inclined to keep an open mind and to adopt parallel working hypotheses for the interpretation of his explorations. PLATE V. RED-SHIFTS The arrows above the nebular spectra point to the H and K lines of calcium The direct photographs (on the same, scale and with approximately the same NGC 4473 is a member of the Virgo Cluster and NGC 379 is a member of a Now let us examine the two assumptions. The true nature of light is still uncertain. For many purposes it of a quantum, and the equivalent wave-length, Because of this relation an increase in implies a decrease in E, or, we may-say, a reduction of E implies an increase in . In either case we observe only the increased wave-length, and we have no direct way of determining which of the two effects is fundamental. If the primary change is in the wave-length, then red-shifts are probably velocity-shifts. But the primary change might possibly be a loss of Red-Shifts as Velocity-Shifts Relative motion in the line of sight shifts the lines in the spectrum of any light-source. If a luminous body is rushing towards the observer, the light-waves are crowded on to one another, and are all direction of the violet end of the spectrum-towards the shorter waves. On the other hand, if the light-source is rapidly receding from the observer, the light-waves are dragged out and lengthened, and the pattern of the spectrum is shifted towards the red. In both cases, whether the shift d is to the red or to the violet, the fractional displacement d / is constant throughout a given spectrum. Each line is shifted by a constant fraction of its normal wave-length. Thus the fraction describes and measures the motion in the line of sight, the `radial velocity' as it v is merely the velocity of light c multiplied by the fractional velocity-shift, 1 For instance, a shift of 0.00001, or one part in a hundred thousand, represents a velocity of 1.86 miles per second; a shift of 0.001, or one-tenth of 1 per cent., a velocity of 186 miles per second. Velocity-shifts of these dimensions, both to the violet and to the red (approaching and receding), are well known in the laboratory, and among the planets and the stars; their study, in fact, is an essential part questioned. Now the red-shifts observed in nebular spectra behave as velocity-shifts behave - the fractional shift d / is constant throughout a given spectrum - and they are readily expressed as velocities of recession. The scale is so convenient that it is widely used, even by those cautious observers who prefer to speak of `apparent velocities' rather than actual motion. For instance, the law of red-shifts is frequently called the When Slipher, in his great pioneering work, assembled the first considerable lists of red-shifts, the observations were necessarily restricted to the brighter, nearer nebulae. Consequently, the shifts were The disturbing features were the, facts that the 'velocities' reached enormous values and were precisely correlated with distance. Each million light-years of distance added a hundred miles per second to the `velocity'. As Humason swept farther and farther out into space he reported `velocities' of 5,000 miles out to the moon in 10 seconds, out to the sun in just over an hour. Red-shifts continue to increase beyond the range of the spectrograph, and, for the faintest nebulae that can be photographed, they are presumably about double the largest recorded shifts - the `velocities' are about 50,000 miles per second. directions, with velocities that are proportional to their distances from the earth. 1 The relation v / c = d / is a first approximation which serves well. enough for small shifts. The rigorous expression, derived from the theory of relativity, is complicated and departs more and more from the simple relation as the shifts increase. BackRed-Shifts as Loss of Energy in Transit Well, perhaps the nebulae are all receding in this peculiar manner. But the notion is rather startling. The cautious observer naturally examines other possibilities before accepting the proposition even as a which the light-quanta travel for many millions of years before they reach the observer, and there may be some interaction between the quanta and the surrounding medium. The problem invites speculation, may lose energy during its journey through space, but if so, we do not yet know how The observer seems to face a dilemma. The familiar interpretation of red-shifts leads to rather startling conclusions. These conclusions can be avoided by an assumption which sounds plausible but which The Critical Test between Alternative Interpretations The distinguishing feature between the two pictures is the recession. So the observer concentrates on the recession. He inquires if there is an empirical test for determining whether or not a luminous body is yes; in principle, at least, a test does exist. A rapidly receding nebula The test is valid in principle but, unfortunately, there is a catch in its application to the particular problem. Our only information concerning great distances is derived from the same apparent The Indirect Test The point of departure for the indirect attack is the scale of distance as determined from apparent luminosities. There are evidently two possible scales, depending upon whether or not the nebulae are the laws of red-shifts and the laws of nebular distribution as derived from the alternate scales of distance. Effects of Red-Shifts on Apparent Luminosity The first step in the venture is the calculation of the proper corrections which must be applied to the measured apparent luminosities before the distances can be estimated. There are two possible The rate of arrival, the number of quanta which the observer intercepts each second, is necessarily reduced by recession of the nebulae. The appropriate correction, known as the recession factor, must be The Energy Effect are altered by red-shifts, quite-apart from the question of recession. In view of the fundamental relation the mere presence of red-shifts, the observed increase in wave-lengths, necessarily implies a reduction in energy effect operates regardless of the interpretation of red-shifts. It must be applied The calculation of the energy effect starts from the fact that the fractional red-shift d / is constant throughout a given spectrum. Each wave-length is increased, and, consequently, the energy in each quantum is reduced, by the constant factor 1 + d / . We might naturally conclude that the total luminosity, the sum of all the individual energies, would be reduced by the same factor. The conclusion, d / to a factor that approaches 1 + 3d / . More precisely, the photographic magnitudes, to use the technical measure of apparent faintness, are increased by the increment, represents the non-linear law of red-shifts that follows from the assumption that red-shifts are velocity-shifts. The first term kr is the linear relation previously derived without the correction for recession. Expressed in terms of velocities the value of k represents a rate of increase of about 100 miles per second per Moreover, the receding nebulae could be traced backward in time to a very remarkable epoch, about 1,860 million years ago. At that epoch the nebulae would all have been found in our immediate t0, is back in time about 1,860 million years. In the favoured, expanding worlds of relativistic cosmology, the period was generally called `the age of the Efforts were made to crowd a vast multitude of events into the brief span, but serious difficulties were encountered. These difficulties often led to the expectation that, when departures from the approximate Well, we have the first intimation of the nature of the departures - and they are positive. Long ago when the light we now record left the very distant nebulae, the expansion was more rapid than it is to-day. The the term lr2. Actually, the third, and higher, order terms should be included with the second term, but they are presumably so small that they can be neglected in the present discussion. Within the range of existing spectrographs, at any rate, they are smaller than the uncertainties of the measures. The coefficient l is definitely a positive quantity, and its value is about 2.5 × 10⁻¹⁹ (light-years)-2. Expressed in terms of velocities it corresponds to about one-twentieth of a mile per second at a distance of a million light-years. The term seems insignificant, and certainly it does not become appreciable until of the distance. At 100 million light-years the term adds about 500 miles per second to the linear term, and at 500 million light-years about 12,500 miles per second. The chief significance of the term for cosmological theory lies in the positive sign. The rate of expansion of the universe has been slowing down, at least for the past several hundred million years. The `age of t0, clearly falls within the life-history of the earth, probably within the history of life on the earth. And, as The Dilemma while the unknown, alternative interpretation leads to conclusions that seem plausible and even familiar. PLATE VI. REMOTE CLUSTERS The two clusters reproduced in the plate are extremely remote and, consequently, The Boötes cluster, at 240 million d / = 0.1307, which corresponds with a The Hydra cluster, 5' north and 2.7' CHAPTER III THE previous lecture described the appearance and behaviour of red-shifts in the spectra of nebulae, and nebulae and the observer; they represent some unknown reaction between the light and the medium through which it travels. In principle, at least, it is possible to distinguish between the alternatives, because a rapidly receding nebula should appear fainter than a stationary nebula at the same distance. The test cannot be applied With this end in view, the effects of recession on apparent luminosity, and, consequently, on estimated distances, were calculated, and the laws of red-shifts were formulated precisely both with and without The assumption of motion, on the other hand, led to a non-linear law of red-shifts, according to which the velocities of recession accelerate with distance or with time counted backward into the past. A Surveys of Nebulae formulated with the alternative scales of distance. The preliminary reconnaissance had indicated that the Each survey, although it required many months or some years for completion, is summarized by a single symbol Nm, which represents the average number of nebulae per unit area, brighter than a specified limit of apparent faintness. It is unnecessary to describe the simple but laborious methods by which the nebular counts were reduced to a standard, homogeneous system, and the limits of apparent faintness determined with considerable accuracy. It is sufficient to say that, in their final forms, the surveys Analysis of the surveys consists in the comparison of numbers of nebulae with the volumes of space they occupy. If the large-scale distribution is uniform, the numbers will evidently be proportional to the Now let us follow this programme of investigation. Each survey indicates the number of nebulae in the sky that are brighter than a certain limit of apparent faintness (corrected for local obscuration within the, When the surveys are compared, the crude observations, uncorrected for red-shifts - the World Picture, to use Professor Milne's happy phrase - indicate that the number of nebulae increase less rapidly than the appear to thin out with distance. Table 2:Surveys of Nebulae md / log N 20.340.2313.16219.530.1582.68619.030.1252.34218.68*0.1062.16118.110.0861.886 m is limiting magnitude actually observed, corrected for local obscuration and for energy-effects; d / is the red-shift corresponding to the limiting magnitude m; log N is the logarithm of the average m. * The fourth survey was made by N. U. Mayall using the 36-inch reflector at the Lick Observatory. The five surveys are discussed in Contributions of the Mount Wilson Observatory, No. 557; Astrophysical Journal, 84, 517, Dec. 1936.The energy-corrections lead to the first of the two -scales of distance, namely, that which follows from The Law of Nebular Distribution when Red-Shifts are not interpreted as Velocity-Shifts We can now formulate the law of nebular distribution on the assumption that the nebulae are not rapidly receding. 3 The energy-corrections corresponding to red-shifts at the limits of the various surveys exactly compensate for the apparent thinning out in the World Picture. Numbers of nebulae are strictly proportional to the volumes of space they occupy. If the universe is not rapidly expanding, the This important conclusion is derived by comparing simple counts of nebulae with measured luminosities, corrected by energy-factors which must be applied to such measures regardless of apparent departures can be expressed as corrections to m, is which agrees very closely with the energy-corrections The energy-corrections, it will be recalled, are the total effects of red-shifts on apparent luminosities, provided red-shifts are not velocity-shifts. The latter interpretation seems to follow directly from the The assumption of uniformity has much to be said in its favour. If the distribution were not uniform, it would either increase with distance, or decrease. But we would not expect to find a distribution in which A thinning out would be readily explained in either of two ways. The first is space absorption. If the nebulae were seen through a tenuous haze, they would fade away faster than could be accounted for by Both explanations seem plausible, but neither is permitted by the observations. The apparent departures from uniformity in the World Picture are fully compensated by the minimum possible corrections for In this case all the empirical information we have concerning the observable region as a whole is internally consistent. The region appears to be thoroughly homogeneous - an insignificant sample of a 3 The linear law of red-shifts (omitting recession factors) is d / = kr, and may be written where d / is the mean red-shift for nebulae of apparent magnitude m0; m0 is the measured magnitude corrected for local obscuration; the constant, which involves k and the intrinsic luminosity of nebulae (candle-power), is -4.707. From this equation red-shifts and the corresponding energy-effects m = 3d / are readily derived for the limiting magnitude of each survey. BackThe Problem of Distribution in an Expanding Universe Therefore, we must consider the alternative scale of distance, and formulate the law of distribution on the assumption that red-shifts are the familiar velocity-shifts, and do measure the expansion of the d / . When these effects are removed from the measures, the nebulae appear brighter, and the distances are less than those estimated The light which reaches us to-day left the limits of the various surveys far back in past time. From the limit of the deepest survey, for instance, the light started about 4.00 million years ago. It travelled for We count a certain number of nebulae and we know that they were scattered through a certain volume of space when the light left the limit of the survey. But to-day, many millions of years later, these same These considerations emphasize the complexity of the problem of distribution in an expanding universe. The first step in the solution is the choice of a common epoch to which the different surveys will be now, the time at which the surveys were made. Then, knowing the At this point the procedure becomes arbitrary. The calculations, in the present stage of knowledge, may be made in various ways, and the choice involves assumptions concerning the nature of the universe. As a simple illustration, does an individual nebula maintain a constant velocity as it recedes into the depths of space, or does its velocity steadily increase with increasing distance? This and other more technical Most of the current models are derived from relativistic cosmology. Moreover, the outstanding exception, Professor Milne's kinematical model, is so outwardly similar, in several of its aspects, to a Expanding Universes of General Relativity Relativistic cosmology is a natural offshoot of Einstein's theory of general relativity. However, the cosmology is a superstructure, including other principles, and, if the present formulation were found to The kinds of universes that would be compatible with the relativity principle and the assumption of homogeneity have been determined by intricate mathematical reasoning. A body of necessary the relativistic laws of gravitation. Another important aspect of such universes is the highly abstract concept of spatial curvature. The relativity principle states, that the geometry of space is determined by the contents of space. Theoretical The general formulae which describe expanding universes include three arbitrary terms. These represent (a) the nature of the expansion, (b) the nature of the spatial curvature, and (c) the nature of the contents The first step has already been taken. For the law of red-shifts, the deviations from linearity introduced by the recession factors, has determined one of the three elements. If the universe is expanding, we now Comparison of Observations with Theory now, in accordance with the principles of relativistic cosmology. We wish to know the relative numbers of nebulae which an terms. 4 Actually, the expression is just that previously derived for uniform distribution in a stationary universe, plus two extra terms. One of the terms represents the recession factor, the other represents effects of spatial curvature. If the use of a logarithm is permitted, the situation may be clearly represented by a pair of equations. If nebulae are uniformly distributed through a non-expanding universe in which red-shifts are not primarily Fig. 3. The Law of Nebular Distribution on Alternative Interpretations of Red-Shifts. Each N, brighter than the limiting magnitude m. The black disks represent the 10 N = 0.6m - 9.05, and indicate uniform distribution of nebulae in 4 The requisite formulae have been derived by various investigators. Those used in the present discussion were developed by R. C. Tolman (Relativity, Thermodynamics, and Cosmology, Clarendon Astrophysical Journal, 82, 302, 1935) Back5 The derivation is as follows. For uniform distribution numbers of nebulae N are proportional to volumes of space, and, consequently, to the cubes of the limiting distances r to which the counts are 10 N = 3 log10 r + constant. Among objects of the same candle-power the distances are proportional to the inverse square of the apparent luminosity l. Hence log10 r = constant - 0.5 log10 l. Apparent magnitudes m measure apparent luminosities on a logarithmic scale. By definition, m = 10 l. Hence and Back Spatial Curvature The departures from uniformity are positive; the numbers of nebulae increase faster than the volume of space through which they are scattered. Thus the density of the nebular distribution increases outwards, There seems to be no other escape. Observations demonstrate that Relativistic cosmology requires that Therefore, The curvature of space is demonstrated and measured by the postulated recession of the nebulae. To the observer the procedure seems artificial. He has counted the nebulae to various limits, applied only the Well, perhaps the interpretation is correct and we do inhabit a rapidly expanding universe. In that case the surveys indicate the nature and amount of the spatial curvature. It must be such that the effects on the investigations near the limits of a great telescope. 6 They may be improbable, but they are not impossible. Therefore, the expanding universe can be saved by introducing a sufficient amount of spatial curvature. The plausible values are narrowly limited, and they indicate a radius of curvature that is The nature of the curvature has rather grave implications. Since the curvature is positive, the universe is closed. Space is closed as the surface of a sphere is closed. The universe has a definite, finite volume quarter, can be explored with existing telescopes. 7 The small volume of the universe is another strange and dubious conclusion. The familiar interpretation of red-shifts as velocity-shifts very seriously restricts not only the time scale, the age of the universe, but the spatial dimensions as well. On the other hand, the 6 A systematic error of the order of 0.35 mag., in the limiting magnitudes of the surveys, as compared with the magnitudes of the nebulae used in the formulation of the law of red-shifts, would be required in Cv = d / . Back7 The volume of this universe would be 2 2 R3, where R is the radius of curvature, or about 2 × 1027 cubic light-years. The universe would contain about 400 million nebulae. BackThe Permissible Type of an Expanding Universe These conclusions in themselves are important factors in the study of expanding models of the universe, but the implications of the empirical data can be pushed still farther. The nature of the expansion and the