/
Quantifying Heat Advection by  Groundwater  Flow in the Active Quantifying Heat Advection by  Groundwater  Flow in the Active

Quantifying Heat Advection by Groundwater Flow in the Active - PowerPoint Presentation

danika-pritchard
danika-pritchard . @danika-pritchard
Follow
343 views
Uploaded On 2019-11-05

Quantifying Heat Advection by Groundwater Flow in the Active - PPT Presentation

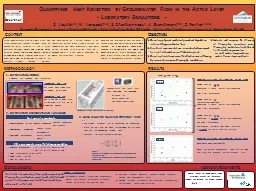
Quantifying Heat Advection by Groundwater Flow in the Active Layer Laboratory Simulations S Veuille 12 M Verpaelst 12 S Charbonneau 1 K Grandmont 12 D Fortier 123 1 Geography ID: 763369

flow thawing convection conduction thawing flow conduction convection thermal efficiency rate water air heat silt cells parameters influence temperatures

Share:

Link:

Embed:

Download Presentation from below link

Download Presentation The PPT/PDF document "Quantifying Heat Advection by Groundwat..." is the property of its rightful owner. Permission is granted to download and print the materials on this web site for personal, non-commercial use only, and to display it on your personal computer provided you do not modify the materials and that you retain all copyright notices contained in the materials. By downloading content from our website, you accept the terms of this agreement.


Presentation Transcript

Quantifying Heat Advection by Groundwater Flow in the Active Layer - Laboratory Simulations -S. Veuille1,2, M. Verpaelst1,2, S. Charbonneau1, K. Grandmont1,2, D. Fortier 1,2,31Geography Department, University of Montreal, QC, Canada; 2Center for Northern Studies, QC, Canada; 3Institute of Northern Engineering, University of Alaska Fairbanks, AK, USA 8 wooden cells equipped with thermistors 4 of them were submitted to thawing by AIR only 4 of them were submitted to thawing by AIR and FLOWING WATER Temperatures and flow rates were controlled and recorded ε is : The thawing efficiency rate of conduction VS conduction 20 experiments using the following variables Measurements of soil thermal propertiesGeotechnical propertiesControlled parameters GranulometryWater contentDensity Thermal parameters Ta : 15°C or 5°C (warm or cold) Tw: 15°C or 5°C (warm or cold)Flow rate from 0.1 to 0.8 cm3/sSlope from 1 to 25 %Soils Silt Sand or Ice Soil specific constants 1. Experimental design 2. Experiments: constants and variables 3. Data analysis: Thawing efficiency rate Where:N and M are respectively the total number of cells in conduction and convection. ti and sj are respectively the thawing time for conduction and convection. Methodology Results Thawing efficiency as a function of the flow Thawing efficiency as a function of the slope When Tw > Ta ( , ) Under the present experimental flow rate the slope had a very little influence on the efficiency rate Objectives Conclusions Rising temperatures due to climate change affect permafrost thermal regime through convective heat transfer at the air-soil interface. Surface run-off and groundwater flow also impact the ground thermal regime by convective heat transfer processes and must be taken into account to obtain an accurate global thermal balance. The magnitude of surface run-off and subsurface water flow is strongly related to topography, and both processes contribute to the thawing in the active layer. This phenomenon is even more pronounced where the active layer is ice-rich. Although the influence of heat advection has already been demonstrated, the efficiency of thawing by convection compared to thawing by conduction has been poorly quantified so far. This knowledge gap has been in part created by the impossibility to control all parameters in natural settings. Context The influence of water flow when Tw > Tair is stronger for the silt than for the sand Thermal conductivityHeat capacity Specific gravity Wooden cell design and thermistors location Convection cells ( CV) Conduction cells (CD) Develop physical models of permafrost degradation induced by groundwater flow Conduct experimentations in a controlled environment to link field conditions with laboratory tests Evaluate and compare the efficiency of thawing by convection versus thawing by conduction for different field condition parameters: air and water temperatures, water flow, slope, and soils Develop tools to measure the effectiveness of thawing by convection versus thawing by conduction Use Finite Element Numerical Thermal Models to calibrate models with experimental data.Develop an index to evaluate heat advection in permafrost terrain similar to the snow n-factor. Methods for evaluating thawing by convection VS thawing by conduction were found, which allowed quantified comparisons for different conditions observed in the field. FUTURE PERSPECTIVES To compare theorical results with experiments, identify and quantify differences, an energy balance of an entire cell must be done. Air Temp (Ta) W ater Temp (Tw) S oil Temp (TCV or TCD) Based on the ratio between the conduction thawing time and the convection thawing time Calculated for each thermistor location SAND ( ) AND SILT ( ) When Tw = Ta ( , ) When Tw < Ta ( ) S A N D S I L T S A N D With w ater flow at 0,16 cm 3 /s Convection is slightly better than conduction Flow is not determinant (not yet estimated for the silt) Convection is slightly better than conduction Flow is not determinant Convection is strongly better than conduction.The flow is determinant ES24A-0142 acknowledgments Special thanks to Janice Festa from Transport Canada for the financial support and making this project happen.