/
 Transmission of material in th is release is embargoed until USDL  a  Transmission of material in th is release is embargoed until USDL  a

Transmission of material in th is release is embargoed until USDL a - PDF document

danika-pritchard
danika-pritchard . @danika-pritchard
Follow
479 views
Uploaded On 2014-11-11

Transmission of material in th is release is embargoed until USDL a - PPT Presentation

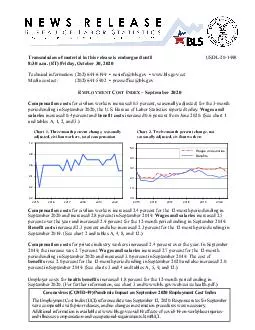
m EDT Friday October 31 2014 Technical information 202 6916199 ncsinfoblsgov wwwblsgovect Media contact 202 6915902 pressofficeblsgov MPLOYMENT OST NDEX EPTEMBER 2014 Compensation costs for civilian workers increased 07 percen t seasonally adjuste ID: 10312

EDT Friday October

Share:

Link:

Embed:

Download Presentation from below link

Download Pdf The PPT/PDF document " Transmission of material in th is relea..." is the property of its rightful owner. Permission is granted to download and print the materials on this web site for personal, non-commercial use only, and to display it on your personal computer provided you do not modify the materials and that you retain all copyright notices contained in the materials. By downloading content from our website, you accept the terms of this agreement.


Presentation Transcript

Coronavirus (COVID Pandemic mpact on September 2020 Employment Cost Index The Employment Cost Index (ECI) reference date was September 12, 2020. Response rates for September were comparable with prior releases, and no changes in estimation procedures were necessary. Additional information is available at www.bls.gov/bls/effects-of-covid-19-on-workplace-injuries Transmission of materialthis releaseis embargoed until USDL-20-1998 8:30 a.m. T) FridayOctober 30 Technical information: (202) 691-6199ncsinfo@bls.govwww.bls.gov/ectMediacontact: (202) 691-5902pressoffice@bls.gov MPLOYMENT OSTNDEX Compensation costs for civilian workers increased 0.5 percent, seasonally adjusted, for the 3-month period ending in September 2020, the U.S. Bureau of Labor Statistics reported today. Wages and salariesincreased 0.4 percent and benefit costsincreased percentfrom June 2020. (See chart 1 and tables A, 1, 2, and 3.) Compensation costs for civilian workers increased 2.4 percent for the 12-month period ending in Septemberand increased 2.8 percent in SeptemberWages and salaries increased Compensation costsforprivate industry workers increased 2.4 percent over the y. InSeptember2019, the increase was 2.7 percentWages and salaries increased 2.7 percent for the 12-month period ending in Septemberand increased 3.0 percent in September 2019. The cost of benefits rose Employer costs for health benefits increased 1.8 percent for the 12-month period ending in September 2020. (For further information, see chart 3 and www.bls.gov/web/eci/echealth.pdf.) Chart 1. Three month percent change, seasonally adjusted total compensation 0.00.20.40.60.81.0201520162017201820192020 0.01.02.03.04.05.0201520162017201820192020 Wages and salaries Benefits Chart 2. Twelve month percent change, not seasonally adjusted , civilian workers Chart 5. Twelve month percent change, not seasonally adjusted, state and local governmentworkers co increases for in Spercent for elated occupations o 3.7 percent for ervice cupations. Withinindustry spersectors,compensation cost ncreases angefrom 2.1 percent cation and health services percentfor leisur hospitality.(See table 5.) Compensation costs for state and local government workers increased 2.3 percent for the 12-month period ending in September 2020, compared with an increase of 3.1 percentSeptemberWages and salaries increased percent for the 12-month period ending in Septemberandpercent a year agoBenefit costs ncreased percent for the 12-month period ending in September 2020. The prior year increase was percent. (See chart 5 and tables A, 7, 11, and 12.) Chart 4. Twelvemonth percent change, not seasonally adjusted, private industryworkers Chart 3. Twelve month percent change, not seasonally adjusted, private industryworkers 0.01.02.03.04.05.0201520162017201820192020 Health benefits Benefits 0.01.02.03.04.05.0201520162017201820192020 Wages and salaries Benefits 0.01.02.03.04.05.0201520162017201820192020 Wages and salaries Benefits -2 - TECHNICAL NOTEThe Employment Cost Index (ECI) measures the change in the cost of labor, free from the influence of employment shifts among occupations and industries. For information on survey concepts, coverage, methods, nonresponse adjustment, and imputation see National Compensation MeasuresHandbook of Methods www.bls.gov/opub/hom/ncs/home.htm. Sample size Data for this reference period were collected from a probability sample of approximately occupational observations selected from a sample of about 6,200 private industry establishments and approximately 7,800 occupational observations selected from a sample of about 1,400 state and local government establishments that provided data at the initial interview. Standard errors To assist users in ascertainingthe reliability of ECIseries, standard errors of all current quarter not seasonally adjusted 3- and 12-month percent change series are also vailable, seewww.bls.gov/ncs/ect/ectvar.htm and the database query toolwww.bls.gov/ncs/ect/data.htm. Standard errors provide users a measure of the precision of an estimate to ensure that it is within an acceptable range for their intended purpose. Historical listings Historical listings are available at www.bls.gov/ect/#tablesThe continuous occupational and industry series listing uses the Standard Industrial Classification Manual and Occupational ClassificationSystemseries from 1975 through 2005 and the North American Industry Classification System and Standard Occupational Classification from 2006 to the present. It provides the official series deemed continuous after the change in classification systems. For more information on the criteria used in defining continuous series, see the article published in the Monthly Labor Review at www.bls.gov/opub/mlr/2006/04/art2full.pdf Employer Costs for Employee Compensation data The costs per hour worked of compensation components are published as part of the Employer Costs for Employee Compensation news release (ECEC). The ECEC release dates are available atwww.bls.gov/schedule/news_release/ecec.htmHistorical ECEC data are available in summary documents at www.bls.gov/ect/#tablesSince the ECEC is calculated with current employment weights rather than the fixed weights used in computing the ECI, year-year changes in the cost levels usually differ from those in the ECI. Fixed mployment eights For additional information on the use of fixed employment weights in computing the ECI, see www.bls.gov/opub/mlr/2016/article/introducing-2012-fixedemploymentweightsfortheemployment-cost-index.htm. Seasonal factors Detailed information on seasonal factors for the 2020 reference year and the revisions of historical seasonally adjusted data for the most recent five years can be found at www.bls.gov/ncs/ect/ectsfact.htm. Table1.EmploymentCostIndexfortotalcompensation,byoccupationalgroupandindustry[Seasonallyadjusted]OccupationalgroupandindustryPercentchangesfor3-monthsended-CivilianworkersAllworkers..................................140.7141.40.70.70.70.60.70.70.80.50.5Goods-producingindustries............137.7138.10.30.60.80.70.80.70.50.70.3Manufacturing..........................137.1137.70.20.60.80.70.70.70.50.70.4Service-providingindustries............141.4142.10.70.70.70.60.70.60.90.40.5Educationandhealthservices.......140.0140.90.80.70.60.70.70.50.80.20.6Educationalservices................141.4141.70.70.70.70.70.90.60.60.70.2Elementaryandsecondaryschools..........................141.5142.20.80.70.70.70.90.60.70.60.5Juniorcolleges,colleges,universities,andprofessionalschools..........................140.9140.40.50.80.60.70.70.60.60.6-0.4Healthcareandsocialassistance.........................138.7140.20.80.70.50.60.70.50.7-0.11.1Hospitals...........................140.3141.00.50.90.70.60.70.60.60.70.5Nursingandresidentialcarefacilities.........................136.6137.50.60.70.50.60.60.40.70.70.7Publicadministration..................145.6146.30.80.70.90.60.80.80.80.60.5PrivateindustryworkersAllworkers...................................139.9140.60.70.70.70.60.70.70.80.40.5OccupationalgroupManagement,professional,andrelated...................................138.3138.90.50.60.50.60.60.50.70.30.4Management,business,and®nancial..............................140.1140.50.50.70.60.70.60.50.60.40.3Professionalandrelated..............137.0137.80.60.50.50.50.50.60.70.10.6Salesandoffice..........................141.5141.70.80.90.60.70.80.70.90.70.1Salesandrelated......................137.9137.30.91.10.50.50.90.81.31.0-0.4Officeandadministrativesupport....143.9144.70.70.80.70.70.70.60.60.60.6Naturalresources,construction,andmaintenance............................139.7140.50.40.70.70.40.80.71.00.20.6Construction,extraction,farming,®shing,andforestryoccupations...139.6140.30.40.60.80.70.90.71.2-0.60.5Installation,maintenance,andrepair.................................139.8140.60.40.60.50.10.70.60.81.00.6Production,transportation,andmaterialmoving........................141.7142.60.70.61.00.70.70.90.70.90.6Production..............................138.5139.40.40.50.90.70.50.70.71.00.6Transportationandmaterialmoving................................145.7146.71.00.71.10.70.81.20.61.00.7Serviceoccupations......................143.1144.40.90.90.91.00.71.10.80.80.9Goods-producingindustries..............137.6138.10.30.60.80.80.80.60.50.70.4Construction...............................139.0139.40.40.70.80.91.00.70.50.90.3Manufacturing.............................137.1137.70.20.60.80.70.70.70.50.70.4Aircraftmanufacturing.................122.3123.4-6.70.20.70.40.30.2-1.61.50.9Service-providingindustries..............140.6141.40.80.70.60.60.70.70.90.40.6Trade,transportation,andutilities......143.1143.71.20.60.80.50.70.80.70.70.4Wholesaletrade.......................137.6138.01.80.70.8-0.30.70.11.20.70.3Retailtrade.............................143.7144.60.90.60.70.80.80.90.60.50.6Transportationandwarehousing....147.4147.91.10.60.90.80.81.30.60.90.3Utilities..................................152.8153.50.80.61.60.70.60.80.10.90.5Information................................138.2138.90.80.40.5-0.90.40.80.60.90.5Financialactivities........................140.5141.00.30.60.90.41.20.50.80.60.4Financeandinsurance................141.1141.50.20.51.00.31.20.60.90.50.3Seefootnotesatendoftable. Table1.EmploymentCostIndexfortotalcompensation,byoccupationalgroupandindustryÐContinued[Seasonallyadjusted]OccupationalgroupandindustryPercentchangesfor3-monthsended-Creditintermediationandrelatedactivities..............................139.9140.50.30.80.90.41.40.60.70.90.4Insurancecarriersandrelatedactivities..............................141.7142.60.10.41.20.30.90.60.30.70.6Realestateandrentalandleasing...137.8138.70.61.00.70.50.70.50.10.90.7Professionalandbusinessservices...140.7141.20.80.60.40.80.70.61.20.10.4Professional,scienti®c,andtechnicalservices...................142.4142.81.10.60.20.80.60.61.3-0.30.3Administrativeandsupportandwastemanagementandremediationservices................138.2139.00.60.70.80.80.60.61.10.70.6Educationandhealthservices..........138.1139.40.80.70.40.60.70.50.8-0.10.9Educationalservices..................139.7139.20.60.60.40.61.00.41.00.6-0.4Juniorcolleges,colleges,universities,andprofessionalschools............................141.2140.00.70.70.70.60.60.60.90.4-0.8Healthcareandsocialassistance...137.8139.40.80.80.40.60.70.50.8-0.31.2Hospitals.............................139.7140.50.50.90.50.70.70.60.50.70.6Nursingandresidentialcarefacilities............................134.7135.80.50.70.60.50.50.50.80.70.8Leisureandhospitality...................142.9144.30.81.30.80.70.51.11.20.81.0Accommodationsandfoodservices..............................144.8146.50.71.11.10.90.61.11.40.81.2Otherservices,exceptpublicadministration..........................140.9141.70.21.11.00.90.11.20.60.40.6StateandlocalgovernmentworkersAllworkers...................................143.7144.30.70.70.70.70.80.60.70.60.4Educationandhealthservices..........142.2142.70.70.80.70.70.90.60.60.60.4Educationalservices..................141.8142.30.70.70.70.70.90.60.60.60.4Schools...............................141.7142.20.70.80.70.70.90.60.60.60.4Elementaryandsecondaryschools..........................142.0142.70.80.80.70.70.90.60.70.60.5Healthcareandsocialassistance...145.5145.80.60.70.80.70.80.60.80.60.2Hospitals.............................142.7143.10.50.81.00.70.80.70.80.60.3Publicadministration..................145.6146.30.80.70.90.60.80.80.80.60.5Includeswages,salaries,andemployercostsforemployeebene®ts.Includesworkersintheprivatenonfarmeconomyexceptthoseinprivatehouseholds,andworkersinthepublicsector,exceptthefederalIncludesmining,construction,andmanufacturing.Includesthefollowingindustries:wholesaletrade;retailtrade;transportationandwarehousing;utilities;information;®nanceandinsurance;realestateandrentalandleasing;professionalandtechnicalservices;managementofcompaniesandenterprises;administrativeandwasteservices;educationalservices;healthcareandsocialassistance;arts,entertainmentandrecreation;accommodationandfoodservices;otherservices,exceptpublicadministration;andpublicadministration.Includesthefollowingindustries:wholesaletrade;retailtrade;transportationandwarehousing;utilities;information;®nanceandinsurance;realestateandrentalandleasing;professionalandtechnicalservices;managementofcompaniesandenterprises;administrativeandwasteservices;educationalservices;healthcareandsocialassistance;arts,entertainmentandrecreation;accommodationandfoodservices;andotherservices,exceptpublicadministration.SOURCE:U.S.BureauofLaborStatistics,NationalCompensationSurvey Table2.EmploymentCostIndexforwagesandsalaries,byoccupationalgroupandindustry[Seasonallyadjusted]OccupationalgroupandindustryIndexes(Dec.Percentchangesfor3-monthsended-CivilianworkersAllworkers..................................139.6140.20.80.80.70.70.80.70.90.40.4Goods-producingindustries..............139.5140.00.60.80.80.80.90.80.70.80.4Manufacturing.............................139.1139.90.60.80.80.70.80.80.70.60.6Service-providingindustries..............139.7140.30.80.80.70.60.80.71.00.30.4Educationandhealthservices..........135.8136.70.80.70.50.60.90.40.80.00.7Educationalservices..................133.8133.80.70.60.50.51.10.50.60.60.0Elementaryandsecondaryschools............................132.5132.90.70.60.50.51.20.50.60.50.3Juniorcolleges,colleges,universities,andprofessionalschools............................135.5134.90.50.80.60.60.70.50.60.4-0.4Healthcareandsocialassistance.....138.2139.80.90.70.50.50.70.60.9-0.41.2Hospitals................................139.3139.90.50.90.60.60.70.70.70.60.4Publicadministration.....................135.8135.80.60.70.70.70.60.60.70.60.0PrivateindustryworkersAllworkers...................................140.8141.50.80.70.70.70.80.71.00.40.5OccupationalgroupManagement,professional,andrelated...................................139.3139.80.80.60.50.70.60.50.90.10.4Professionalandrelated..............137.9138.80.80.50.40.50.60.61.0-0.10.7Management,business,and®nancial..............................141.1141.20.70.60.70.70.60.50.80.40.1Salesandoffice..........................142.2142.30.90.90.70.70.90.81.10.70.1Salesandrelated......................139.7138.81.11.10.50.71.01.01.61.0-0.7Officeandadministrativesupport....144.1144.90.70.80.80.80.90.70.80.50.6Naturalresources,construction,andmaintenance............................139.4140.20.50.70.70.70.90.71.30.10.6Construction,extraction,farming,®shing,andforestryoccupations...139.3140.00.50.70.70.90.80.81.6-0.70.5Installation,maintenance,andrepair.................................139.5140.50.40.70.50.71.00.51.01.00.7Production,transportation,andmaterialmoving........................143.1144.20.90.71.10.70.91.20.70.90.8Production..............................139.8140.90.80.70.80.70.70.90.80.90.8Transportationandmaterialmoving................................147.0148.11.10.71.40.91.11.40.71.00.7Serviceoccupations......................144.8146.31.01.01.11.10.71.30.90.81.1Goods-producingindustries..............139.5140.10.50.80.80.81.00.80.60.80.4Construction...............................139.9140.20.50.80.71.01.30.80.51.30.2Manufacturing.............................139.1139.90.60.80.80.70.80.80.70.60.6Aircraftmanufacturing.................146.9148.30.40.80.40.50.40.6-0.31.51.0Service-providingindustries..............141.2142.00.90.70.70.60.80.71.10.20.6Trade,transportation,andutilities......142.9143.41.30.51.00.50.90.81.00.70.3Retailtrade.............................145.3146.00.80.50.90.91.01.00.80.60.5Transportationandwarehousing....148.0148.51.30.51.20.91.21.40.81.00.3Utilities..................................147.8148.50.60.60.80.80.60.70.10.80.5Information................................136.6137.30.80.50.80.50.40.81.00.10.5Financialactivities........................141.4141.50.20.61.00.11.30.61.10.40.1Financeandinsurance................142.5142.50.10.51.00.11.40.61.20.30.0Creditintermediationandrelatedactivities...........................138.5139.50.30.61.10.21.50.60.80.50.8Insurancecarriersandrelatedactivities...........................140.2141.3-0.10.41.30.01.00.40.50.30.8Realestateandrentalandleasing...136.9137.70.60.80.70.40.80.60.20.90.6Seefootnotesatendoftable. Table2.EmploymentCostIndexforwagesandsalaries,byoccupationalgroupandindustryÐContinued[Seasonallyadjusted]OccupationalgroupandindustryIndexes(Dec.Percentchangesfor3-monthsended-Professionalandbusinessservices...142.0142.41.00.70.50.90.70.61.60.00.3Professional,scienti®c,andtechnicalservices...................143.9144.11.40.60.10.90.60.62.0-0.50.1Educationandhealthservices..........138.2139.60.80.80.40.60.80.40.9-0.31.0Educationalservices..................138.4137.80.70.50.50.61.10.31.10.7-0.4Juniorcolleges,colleges,universities,andprofessionalschools............................138.7137.40.70.60.60.60.60.61.00.4-1.0Healthcareandsocialassistance...138.1139.91.00.70.40.60.70.50.9-0.61.3Hospitals.............................139.7140.40.51.00.50.70.70.50.70.60.5Leisureandhospitality...................146.5148.10.91.50.90.90.51.21.30.81.1Otherservices,exceptpublicadministration..........................141.6142.60.11.21.00.90.01.40.60.50.7StateandlocalgovernmentworkersAllworkers...................................134.5134.60.70.60.60.60.80.50.60.60.1Educationandhealthservices..........133.4133.60.70.60.50.51.00.50.50.50.1Educationalservices..................132.8133.00.70.70.50.51.00.50.50.50.2Schools...............................132.8133.00.70.60.50.51.10.50.50.50.2Elementaryandsecondaryschools..........................132.3132.70.70.60.50.51.20.50.50.50.3Healthcareandsocialassistance...138.5138.50.50.50.70.50.80.70.70.50.0Hospitals.............................137.6137.60.40.50.80.50.80.70.80.60.0Publicadministration.....................135.8135.80.60.70.70.70.60.60.70.60.0Includesworkersintheprivatenonfarmeconomyexceptthoseinprivatehouseholds,andworkersinthepublicsector,exceptthefederalIncludesmining,construction,andmanufacturing.Includesthefollowingindustries:wholesaletrade;retailtrade;transportationandwarehousing;utilities;information;®nanceandinsurance;realestateandrentalandleasing;professionalandtechnicalservices;managementofcompaniesandenterprises;administrativeandwasteservices;educationalservices;healthcareandsocialassistance;arts,entertainmentandrecreation;accommodationandfoodservices;otherservices,exceptpublicadministration;andpublicadministration.Includesthefollowingindustries:wholesaletrade;retailtrade;transportationandwarehousing;utilities;information;®nanceandinsurance;realestateandrentalandleasing;professionalandtechnicalservices;managementofcompaniesandenterprises;administrativeandwasteservices;educationalservices;healthcareandsocialassistance;arts,entertainmentandrecreation;accommodationandfoodservices;andotherservices,exceptpublicadministration.SOURCE:U.S.BureauofLaborStatistics,NationalCompensationSurvey Table3.EmploymentCostIndexforbene®ts,byoccupationalgroupandindustry[Seasonallyadjusted]OccupationalgroupandindustryIndexes(Dec.Percentchangesfor3-monthsended-CivilianworkersAllworkers..................................143.2144.00.40.70.70.50.60.60.40.80.6PrivateindustryworkersAllworkers...................................137.8138.50.40.50.50.40.50.50.20.70.5OccupationalgroupManagement,professional,andrelated...................................136.1136.80.20.60.50.50.50.60.00.70.5Salesandoffice..........................139.5140.00.70.70.40.50.40.50.20.70.4Naturalresources,construction,andmaintenance............................140.5141.10.30.50.7-0.40.70.50.40.50.4Production,transportation,andmaterialmoving........................138.9139.50.20.40.70.60.30.50.51.00.4Serviceoccupations......................137.4138.10.70.50.20.90.30.60.21.00.5Goods-producingindustries............133.8134.1-0.40.30.90.50.50.30.30.60.2Manufacturing..........................133.3133.5-0.70.30.90.50.40.30.20.80.2Service-providingindustries............139.2140.10.60.60.40.40.50.50.30.70.6StateandlocalgovernmentworkersAllworkers..................................162.0163.30.90.91.00.80.70.80.90.70.8Includesworkersintheprivatenonfarmeconomyexceptthoseinprivatehouseholds,andworkersinthepublicsector,exceptthefederalIncludesmining,construction,andmanufacturing.Includesthefollowingindustries:wholesaletrade;retailtrade;transportationandwarehousing;utilities;information;®nanceandinsurance;realestateandrentalandleasing;professionalandtechnicalservices;managementofcompaniesandenterprises;administrativeandwasteservices;educationalservices;healthcareandsocialassistance;arts,entertainmentandrecreation;accommodationandfoodservices;andotherservices,exceptpublicadministration.SOURCE:U.S.BureauofLaborStatistics,NationalCompensationSurvey Table4.EmploymentCostIndexfortotalcompensation,forcivilianworkers,byoccupationalgroupand[Notseasonallyadjusted]OccupationalgroupandindustryIndexes(Dec.2005=100)Percentchangesfor3-monthsended-12-monthsended-Allworkers..........................................138.1140.6141.40.90.40.62.82.72.4Excludingincentivepaidoccupations.........138.2140.7141.50.80.50.62.82.62.4OccupationalgroupManagement,professional,andrelated.......137.3139.2140.00.80.30.62.52.22.0Management,business,and®nancial.......138.5140.5141.00.70.50.42.62.21.8Professionalandrelated......................136.6138.5139.50.80.10.72.42.22.1Salesandoffice...................................138.9141.9142.41.00.60.43.03.22.5Salesandrelated..............................134.3137.8137.91.40.70.12.94.02.7Officeandadministrativesupport............141.7144.3145.10.80.60.63.02.62.4Naturalresources,construction,andmaintenance....................................137.8140.3141.00.90.40.52.62.72.3Construction,extraction,farming,®shing,andforestryoccupations...................138.2140.1140.80.9-0.20.53.02.31.9Installation,maintenance,andrepair........137.4140.5141.40.91.20.62.23.22.9Production,transportation,andmaterialmoving...........................................138.6142.1143.10.80.80.73.03.33.2Production.......................................135.3138.7139.50.50.90.62.73.03.1Transportationandmaterialmoving.........142.4146.0147.21.00.60.83.33.53.4Serviceoccupations..............................140.8144.4145.50.70.60.83.43.33.3Goods-producingindustries....................135.2137.8138.20.80.80.33.02.82.2Manufacturing..................................134.5137.2137.60.50.70.32.82.52.3Service-providingindustries....................138.6141.2142.00.80.40.62.72.72.5Educationandhealthservices...............138.0139.6141.01.10.11.02.82.32.2Educationalservices........................138.9140.5141.81.60.30.93.02.82.1Elementaryandsecondaryschools....139.1140.6142.31.80.31.23.12.92.3Juniorcolleges,colleges,universities,andprofessionalschools..............138.6140.3140.61.20.30.22.92.51.4Healthcareandsocialassistance........137.2138.7140.20.7-0.21.12.51.82.2Hospitals...................................137.6140.3140.90.70.60.42.82.62.4Nursingandresidentialcarefacilities...133.9136.4137.40.60.60.72.42.52.6Publicadministration...........................142.5145.0146.21.10.30.83.02.92.6Includeswages,salaries,andemployercostsforemployeebene®ts.Includesworkersintheprivatenonfarmeconomyexceptthoseinprivatehouseholds,andworkersinthepublicsector,exceptthefederalTheindexforthisseriesisnotstrictlycomparablewithotherseriesinthistable.Includesmining,construction,andmanufacturing.Includesthefollowingindustries:wholesaletrade;retailtrade;transportationandwarehousing;utilities;information;®nanceandinsurance;realestateandrentalandleasing;professionalandtechnicalservices;managementofcompaniesandenterprises;administrativeandwasteservices;educationalservices;healthcareandsocialassistance;arts,entertainmentandrecreation;accommodationandfoodservices;otherservices,exceptpublicadministration;andpublicadministration.SOURCE:U.S.BureauofLaborStatistics,NationalCompensationSurvey Table5.EmploymentCostIndexfortotalcompensation,forprivateindustryworkers,byoccupationalgroupandindustry[Notseasonallyadjusted]OccupationalgroupandindustryIndexes(Dec.2005=100)Percentchangesfor3-monthsended-12-monthsended-Allworkers...........................................137.4140.1140.70.70.50.42.72.72.4Excludingincentivepaidoccupations.........137.5140.1140.80.70.50.52.72.62.4OccupationalgroupManagement,professional,andrelated.......136.4138.4139.00.60.30.42.32.11.9Excludingincentivepaidoccupations......135.7137.6138.30.60.20.52.32.01.9Management,business,and®nancial.......138.1140.2140.70.60.50.42.52.11.9Excludingincentivepaidoccupations....137.1139.1139.50.60.40.32.52.11.8Professionalandrelated......................135.1137.0137.80.50.10.62.11.92.0Salesandoffice...................................138.4141.5141.90.90.60.33.03.22.5Excludingincentivepaidoccupations......140.4143.3143.90.60.70.42.92.72.5Salesandrelated..............................134.2137.7137.81.40.70.12.94.02.7Excludingincentivepaidoccupations....138.4141.8142.20.41.00.32.72.92.7Officeandadministrativesupport............141.4144.1144.80.60.60.53.02.62.4Naturalresources,construction,andmaintenance....................................137.3139.9140.60.80.40.52.52.72.4Construction,extraction,farming,®shing,andforestryoccupations...................137.9139.9140.40.9-0.20.43.12.31.8Installation,maintenance,andrepair........136.7139.9140.80.81.20.62.13.23.0Production,transportation,andmaterialmoving...........................................138.1141.7142.70.70.80.73.03.33.3Excludingincentivepaidoccupations......138.0141.4142.50.60.80.83.13.13.3Production.......................................135.1138.5139.30.50.90.62.73.13.1Excludingincentivepaidoccupations....135.5138.9139.80.50.90.62.83.03.2Transportationandmaterialmoving.........142.0145.7146.90.90.60.83.33.63.5Serviceoccupations..............................139.2143.2144.30.50.70.83.53.43.7IndustryandoccupationalgroupGoods-producingindustries.......................135.1137.7138.20.70.70.43.02.72.3Excludingincentivepaidoccupations.........135.3137.6138.10.60.40.42.82.32.1Management,professional,andrelated.......132.9135.0135.20.50.40.12.72.01.7Salesandoffice...................................138.9142.5142.61.83.90.14.04.52.7Naturalresources,construction,andmaintenance....................................137.3139.2139.90.9-0.10.53.02.31.9Production,transportation,andmaterialmoving...........................................134.2137.5138.20.60.80.52.83.13.0Construction.......................................136.4139.1139.71.31.10.43.53.32.4Manufacturing.....................................134.5137.2137.60.50.70.32.82.52.3Management,professional,andrelated.....133.9136.1136.30.50.50.12.62.11.8Salesandofficeoccupations.................138.8140.1139.90.50.4-0.13.01.40.8Naturalresources,construction,andmaintenance.................................134.6137.6138.20.50.90.42.22.82.7Production,transportation,andmaterialmoving........................................133.9137.2137.90.70.90.52.93.23.0Aircraftmanufacturing.........................122.4122.3123.00.01.30.61.5-0.10.5Service-providingindustries.......................138.1140.8141.50.70.40.52.62.72.5Excludingincentivepaidoccupations.........138.2140.9141.70.60.50.62.62.52.5Management,professional,andrelated.......137.1139.0139.80.60.30.62.22.02.0Salesandoffice...................................138.4141.4141.80.90.30.32.93.12.5Naturalresources,construction,andmaintenance....................................137.4140.9141.80.71.10.61.93.33.2Production,transportation,andmaterialmoving...........................................142.6146.4147.70.80.80.93.23.53.6Serviceoccupations..............................139.2143.1144.30.60.70.83.53.43.7Trade,transportation,andutilities..............140.1143.3143.80.60.80.32.62.92.6Excludingincentivepaidoccupations......140.7144.1144.50.50.80.32.92.92.7Wholesaletrade................................134.8137.7138.00.70.80.22.02.92.4Excludingincentivepaidoccupations....138.2141.1141.20.50.60.12.32.62.2Seefootnotesatendoftable. Table5.EmploymentCostIndexfortotalcompensation,forprivateindustryworkers,byoccupationalgroupandindustryÐContinued[Notseasonallyadjusted]OccupationalgroupandindustryIndexes(Dec.2005=100)Percentchangesfor3-monthsended-12-monthsended-Service-providingindustries-ContinuedRetailtrade......................................140.9144.2144.70.40.90.32.82.82.7Excludingincentivepaidoccupations....139.5143.3143.80.41.10.32.93.13.1Transportationandwarehousing.............143.8147.4148.21.10.60.53.23.73.1Utilities...........................................149.9153.2153.30.20.90.13.52.42.3Information.........................................135.3138.5139.00.41.00.40.72.72.7Financialactivities................................138.0140.9141.21.01.10.23.13.12.3Excludingincentivepaidoccupations......138.0140.8141.50.40.90.52.82.52.5Financeandinsurance........................138.5141.6141.71.01.10.13.13.32.3Creditintermediationandrelatedactivities....................................137.0140.4140.71.21.40.23.63.72.7Excludingincentivepaid.................140.9144.2144.00.71.2-0.13.13.12.2Insurancecarriersandrelatedactivities....139.6142.5142.70.41.40.12.72.42.2Excludingincentivepaidoccupations....138.4141.8141.90.01.40.12.52.52.5Realestateandrentalandleasing..........135.9137.9138.80.70.70.72.92.22.1Excludingincentivepaidoccupations....139.4141.8142.70.50.60.62.92.22.4Professionalandbusinessservices............138.3140.9141.40.70.10.42.62.52.2Professional,scienti®c,andtechnicalservices.......................................140.4142.5142.90.6-0.50.32.32.21.8Administrativeandsupportandwastemanagementandremediationservices...135.0138.3139.00.60.70.52.93.13.0Educationandhealthservices..................136.6138.1139.50.8-0.11.02.51.92.1Educationalservices...........................137.3139.2139.61.60.40.32.63.01.7Juniorcolleges,colleges,universities,andprofessionalschools................138.9140.7140.41.20.2-0.22.52.51.1Healthcareandsocialassistance...........136.4137.9139.40.6-0.31.12.41.72.2Hospitals......................................137.1139.8140.40.50.70.42.82.52.4Nursingandresidentialcarefacilities.....132.2134.7135.80.60.70.82.52.52.7Nursingcarefacilities...................131.4134.0134.90.40.70.72.22.42.7Leisureandhospitality...........................138.4142.8144.10.40.60.93.33.64.1Accommodationsandfoodservice..........140.0144.7146.50.60.71.23.94.04.6Otherservices,exceptpublicadministration...138.0141.1141.80.10.50.53.02.32.8Includeswages,salaries,andemployercostsforemployeebene®ts.Theindexforthisseriesisnotstrictlycomparablewithotherseriesinthistable.Includesmining,construction,andmanufacturing.Includesthefollowingindustries:wholesaletrade;retailtrade;transportationandwarehousing;utilities;information;®nanceandinsurance;realestateandrentalandleasing;professionalandtechnicalservices;managementofcompaniesandenterprises;administrativeandwasteservices;educationalservices;healthcareandsocialassistance;arts,entertainmentandrecreation;accommodationandfoodservices;andotherservices,exceptpublicadministration.SOURCE:U.S.BureauofLaborStatistics,NationalCompensationSurvey Table6.EmploymentCostIndexfortotalcompensation,forprivateindustryworkers,bybargainingstatusandCensusregionanddivision[Notseasonallyadjusted]BargainingstatusandCensusregionandIndexes(Dec.2005=100)Percentchangesfor3-monthsended-12-monthsended-BargainingstatusUnion...............................................141.4144.7145.60.41.10.62.62.83.0Goods-producingindustries.................136.3139.1140.10.71.10.72.72.72.8Manufacturing................................129.1132.7133.50.61.70.62.13.43.4Service-providingindustries.................145.2148.8149.60.31.10.52.52.83.0Nonunion...........................................136.8139.4140.10.70.40.52.72.72.4Goods-producingindustries.................134.7137.2137.60.80.70.33.12.72.2Manufacturing................................135.8138.4138.70.50.60.22.92.42.1Service-providingindustries.................137.3140.0140.70.70.40.52.62.62.5CensusregionanddivisionNortheast..........................................140.0142.6143.10.70.60.43.02.62.2NewEngland...................................143.4145.7146.51.00.60.52.62.62.2MiddleAtlantic..................................138.8141.5141.90.60.60.33.22.52.2South...............................................135.3138.0138.40.81.00.32.52.82.3SouthAtlantic...................................137.5140.3140.70.71.20.32.62.82.3EastSouthCentral.............................134.9136.9137.11.50.50.12.93.01.6WestSouthCentral............................131.8134.7135.10.70.70.32.22.92.5Midwest............................................135.0137.6138.20.70.10.42.62.62.4EastNorthCentral.............................133.5136.1136.70.6-0.20.42.52.62.4WestNorthCentral............................138.7141.3142.00.80.90.52.62.72.4West................................................140.4143.1144.40.60.10.92.82.62.8Mountain........................................137.8140.5141.40.90.70.63.52.92.6Paci®c...........................................141.6144.3145.70.60.01.02.62.62.9Includeswages,salaries,andemployercostsforemployeebene®ts.Includesmining,construction,andmanufacturing.Includesthefollowingindustries:wholesaletrade;retailtrade;transportationandwarehousing;utilities;information;®nanceandinsurance;realestateandrentalandleasing;professionalandtechnicalservices;managementofcompaniesandenterprises;administrativeandwasteservices;educationalservices;healthcareandsocialassistance;arts,entertainmentandrecreation;accommodationandfoodservices;andotherservices,exceptpublicadministration.TheCensusdivisionsarede®nedasfollows:NewEngland:Connecticut,Maine,Massachusetts,NewHampshire,RhodeIslandandVermont;MiddleAtlantic:NewJersey,NewYork,andPennsylvania;SouthAtlantic:Delaware,DistrictofColumbia,Florida,Georgia,Maryland,NorthCarolina,SouthCarolina,Virginia,andWestVirginia;EastSouthCentral:Alabama,Kentucky,Mississippi,andTennessee;WestSouthCentral:Arkansas,Louisiana,Oklahoma,andTexas;EastNorthCentral:Illinois,Indiana,Michigan,Ohio,andWisconsin;WestNorthCentral:Iowa,Kansas,Minnesota,Missouri,Nebraska,NorthDakota,andSouthDakota;Mountain:Arizona,Colorado,Idaho,Montana,Nevada,NewMexico,Utah,andWyoming;andPaci®c:Alaska,California,Hawaii,Oregon,andWashington.NOTE:Theindexesfortheseseriesarenotstrictlycomparabletothosefortheaggregate,occupation,andindustryseries.SOURCE:U.S.BureauofLaborStatistics,NationalCompensationSurvey Table7.EmploymentCostIndexfortotalcompensation,forstateandlocalgovernmentworkers,byoccupationalgroupandindustry[Notseasonallyadjusted]OccupationalgroupandindustryIndexes(Dec.2005=100)Percentchangesfor3-monthsended-12-monthsended-Allworkers...........................................141.0142.9144.31.40.31.03.12.72.3OccupationalgroupManagement,professional,andrelated.......139.6141.4142.71.50.30.93.02.82.2Professionalandrelated......................139.4141.2142.61.50.31.03.12.82.3Salesandoffice...................................143.4145.6147.11.30.31.03.12.92.6Officeandadministrativesupport............143.5145.7147.21.30.31.03.12.92.6Serviceoccupations..............................144.3146.9148.21.20.40.93.13.02.7Educationandhealthservices..................139.7141.3142.71.50.31.03.02.72.1Educationalservices...........................139.3140.9142.41.50.41.13.02.72.2Schools.......................................139.2140.8142.31.50.41.13.02.72.2Elementaryandsecondaryschools....139.5141.0142.81.70.31.33.12.82.4Healthcareandsocialassistance...........142.5144.9145.71.10.20.63.12.82.2Hospitals......................................139.6142.3143.01.10.30.53.33.02.4Publicadministration.............................142.5145.0146.21.10.30.83.02.92.6Includeswages,salaries,andemployercostsforemployeebene®ts.SOURCE:U.S.BureauofLaborStatistics,NationalCompensationSurvey Table8.EmploymentCostIndexforwagesandsalaries,forcivilianworkers,byoccupationalgroupand[Notseasonallyadjusted]OccupationalgroupandindustryIndexes(Dec.2005=100)Percentchangesfor3-monthsended-12-monthsended-Allworkers..........................................137.0139.6140.41.00.40.62.92.92.5Excludingincentivepaidoccupations.........136.8139.3140.10.90.40.62.92.72.4OccupationalgroupManagement,professional,andrelated.......135.7137.6138.30.90.20.52.52.31.9Management,business,and®nancial.......138.2140.3140.70.70.40.32.72.31.8Professionalandrelated......................134.3136.1137.00.90.10.72.42.32.0Salesandoffice...................................138.3141.5142.01.20.50.43.33.62.7Salesandrelated..............................135.2139.2139.21.70.50.03.34.73.0Officeandadministrativesupport............140.3142.9143.80.90.40.63.32.82.5Naturalresources,construction,andmaintenance....................................136.4139.2140.00.90.40.62.93.02.6Construction,extraction,farming,®shing,andforestryoccupations...................136.7139.0139.60.8-0.40.43.12.52.1Installation,maintenance,andrepair........136.2139.4140.51.01.10.82.93.43.2Production,transportation,andmaterialmoving...........................................139.0142.9144.10.90.70.83.43.83.7Production.......................................136.3140.0141.00.60.80.72.93.33.4Transportationandmaterialmoving.........142.0146.0147.51.30.51.04.04.13.9Serviceoccupations..............................139.4143.2144.40.80.60.83.73.53.6Goods-producingindustries....................136.5139.6140.10.90.90.43.33.22.6Manufacturing..................................136.1139.3139.80.70.70.43.13.02.7Service-providingindustries....................137.1139.6140.51.00.30.62.92.82.5Educationandhealthservices...............134.3135.6136.91.3-0.11.02.72.31.9Educationalservices........................132.0133.2134.31.80.30.82.82.71.7Elementaryandsecondaryschools....130.9132.0133.42.00.31.12.92.91.9Juniorcolleges,colleges,anduniversities..............................133.7135.1135.21.20.30.12.72.31.1Healthcareandsocialassistance........136.8138.2139.80.7-0.51.22.51.82.2Hospitals...................................136.6139.2139.80.70.50.42.92.62.3Nursingandresidentialcarefacilities...134.1137.2138.20.70.70.72.93.03.1Publicadministration...........................133.4135.5135.90.90.30.32.72.51.9Includesworkersintheprivatenonfarmeconomyexceptthoseinprivatehouseholds,andworkersinthepublicsector,exceptthefederalTheindexforthisseriesisnotstrictlycomparablewithotherseriesinthistable.Includesmining,construction,andmanufacturing.Includesthefollowingindustries:wholesaletrade;retailtrade;transportationandwarehousing;utilities;information;®nanceandinsurance;realestateandrentalandleasing;professionalandtechnicalservices;managementofcompaniesandenterprises;administrativeandwasteservices;educationalservices;healthcareandsocialassistance;arts,entertainmentandrecreation;accommodationandfoodservices;otherservices,exceptpublicadministration;andpublicadministration.SOURCE:U.S.BureauofLaborStatistics,NationalCompensationSurvey Table9.EmploymentCostIndexforwagesandsalaries,forprivateindustryworkers,byoccupationalgroupandindustry[Notseasonallyadjusted]OccupationalgroupandindustryIndexvalue(Dec.2005=100)Percentchangesfor3-monthsended-12-monthsended-Allworkers...........................................138.0140.9141.70.80.40.63.02.92.7Excludingincentivepaidoccupations.........137.8140.6141.50.70.40.62.92.72.7OccupationalgroupManagement,professional,andrelated.......137.2139.3140.00.60.10.52.32.12.0Excludingincentivepaidoccupations......136.0138.0138.70.60.10.52.42.12.0Management,business,and®nancial.......138.9141.1141.40.70.50.22.72.31.8Excludingincentivepaidoccupations....137.0139.0139.30.60.40.22.62.11.7Professionalandrelated......................136.0138.0138.90.6-0.10.72.12.12.1Salesandoffice...................................138.8142.1142.61.20.40.43.43.62.7Excludingincentivepaidoccupations......140.6143.7144.40.80.60.53.23.02.7Salesandrelated..............................135.3139.3139.31.70.50.03.34.73.0Excludingincentivepaidoccupations....139.5143.2143.60.60.90.33.13.22.9Officeandadministrativesupport............141.4144.2145.00.90.40.63.42.92.5Naturalresources,construction,andmaintenance....................................136.6139.5140.30.90.40.63.03.02.7Construction,extraction,farming,®shing,andforestryoccupations...................137.1139.4140.10.8-0.50.53.22.52.2Installation,maintenance,andrepair........136.3139.6140.71.01.20.82.93.53.2Production,transportation,andmaterialmoving...........................................139.1143.0144.20.90.60.83.53.73.7Excludingincentivepaidoccupations......139.0142.7144.00.80.70.93.63.53.6Production.......................................136.2139.9140.80.60.90.63.03.33.4Excludingincentivepaidoccupations....136.6140.2141.40.70.90.93.13.33.5Transportationandmaterialmoving.........142.6146.8148.21.30.51.04.14.33.9Serviceoccupations..............................140.5144.9146.20.60.70.93.93.74.1IndustryandoccupationalgroupGoods-producingindustries.......................136.5139.6140.20.90.80.43.33.22.7Excludingincentivepaidoccupations.........136.7139.3139.90.70.30.43.12.62.3Management,professional,andrelated.......135.8138.6138.80.50.40.12.82.62.2Salesandoffice...................................140.9145.7145.92.45.20.14.95.93.5Naturalresources,construction,andmaintenance....................................137.2139.4140.11.0-0.30.53.22.62.1Production,transportation,andmaterialmoving...........................................135.4139.0139.90.70.70.63.13.33.3Construction.......................................136.7139.9140.51.51.40.43.73.92.8Manufacturing.....................................136.1139.3139.80.70.70.43.13.02.7Management,professional,andrelated.....136.2139.2139.50.60.40.22.92.82.4Salesandoffice................................139.6141.2141.00.60.4-0.13.41.71.0Naturalresources,construction,andmaintenance.................................136.5140.0140.90.70.80.62.73.23.2Production,transportation,andmaterialmoving........................................135.2138.9139.70.70.90.63.33.53.3Aircraftmanufacturing.........................144.1147.3148.10.01.20.52.12.22.8Service-providingindustries.......................138.4141.3142.10.80.30.62.92.92.7Excludingincentivepaidoccupations.........138.2141.0141.90.70.40.62.92.82.7Management,professional,andrelated.......137.5139.5140.20.70.10.52.32.12.0Salesandoffice...................................138.6141.8142.31.20.10.43.23.52.7Naturalresources,construction,andmaintenance....................................135.9139.6140.70.91.20.82.73.63.5Production,transportation,andmaterialmoving...........................................142.9147.1148.61.10.71.03.94.04.0Serviceoccupations..............................140.5144.9146.20.60.70.94.03.84.1Trade,transportation,andutilities..............139.5143.0143.50.90.80.33.03.52.9Excludingincentivepaidoccupations......139.7143.3143.80.80.80.33.33.42.9Wholesaletrade................................132.2135.1135.40.90.70.22.13.12.4Excludingincentivepaidoccupations....134.8137.7137.90.60.40.12.42.82.3Seefootnotesatendoftable. Table9.EmploymentCostIndexforwagesandsalaries,forprivateindustryworkers,byoccupationalgroupandindustryÐContinued[Notseasonallyadjusted]OccupationalgroupandindustryIndexvalue(Dec.2005=100)Percentchangesfor3-monthsended-12-monthsended-Service-providingindustries-ContinuedRetailtrade......................................142.1145.7146.20.91.00.33.43.42.9Excludingincentivepaidoccupations....140.2144.4144.90.81.10.33.63.83.4Transportationandwarehousing.............143.7147.8148.81.60.60.73.84.53.5Utilities...........................................145.3148.4148.40.21.00.02.92.32.1Information.........................................134.4136.9137.60.50.40.52.42.42.4Financialactivities................................138.7141.8141.71.00.9-0.13.03.32.2Excludingincentivepaidoccupations......137.9140.6140.90.40.60.22.52.32.2Financeandinsurance........................139.7143.1142.61.11.0-0.33.03.52.1Creditintermediationandrelatedactivities....................................136.1139.1139.71.31.00.43.63.52.6Excludingincentivepaid............................139.7142.1142.00.60.4-0.12.92.31.6Insurancecarriersandrelatedactivities...138.6141.1141.40.51.10.22.72.32.0Excludingincentivepaid............................135.9139.2139.5-0.10.90.22.22.42.6Realestateandrentalandleasing..........134.6136.8137.70.90.50.72.72.52.3Excludingincentivepaidoccupations....138.3140.9141.90.70.40.72.72.52.6Professionalandbusinessservices............139.0142.0142.60.8-0.10.42.83.02.6Professional,scienti®c,andtechnicalservices.......................................141.2143.9144.30.8-0.80.32.42.72.2Administrativeandsupportandwastemanagementandremediationservices...136.9140.6141.50.70.70.63.43.53.4Educationandhealthservices..................136.7138.1139.70.9-0.41.22.61.92.2Educationalservices...........................136.1137.8138.31.90.40.42.63.11.6Juniorcolleges,colleges,universities,andprofessionalschools................136.5138.2137.81.30.1-0.32.42.51.0Healthcareandsocialassistance...........136.9138.2140.00.7-0.51.32.51.72.3Hospitals......................................137.0139.7140.30.60.60.42.92.62.4Nursingandresidentialcarefacilities.....134.0137.3138.40.70.70.82.83.23.3Nursingcarefacilities...................132.9136.3137.30.40.80.72.52.93.3Leisureandhospitality...........................141.6146.4147.90.50.61.03.83.94.4Accommodationandfoodservice...........142.9148.1150.10.60.71.44.24.35.0Otherservices,exceptpublicadministration...138.5141.8142.80.00.60.73.12.43.1Theindexforthisseriesisnotstrictlycomparablewithotherseriesinthistable.Includesmining,construction,andmanufacturing.Includesthefollowingindustries:wholesaletrade;retailtrade;transportationandwarehousing;utilities;information;®nanceandinsurance;realestateandrentalandleasing;professionalandtechnicalservices;managementofcompaniesandenterprises;administrativeandwasteservices;educationalservices;healthcareandsocialassistance;arts,entertainmentandrecreation;accommodationandfoodservices;andotherservices,exceptpublicadministration.SOURCE:U.S.BureauofLaborStatistics,NationalCompensationSurvey Table10.EmploymentCostIndexforwagesandsalaries,forprivateindustryworkers,bybargainingstatusandCensusregionanddivision[Notseasonallyadjusted]BargainingstatusandCensusregionandIndexes(Dec.2005=100)Percentchangesfor-3-monthsended-12-monthsended-BargainingstatusUnion...............................................138.1141.2142.20.80.70.73.43.13.0Goods-producingindustries.................133.1135.8136.90.60.70.82.72.62.9Manufacturing................................129.6133.5134.70.81.20.92.13.83.9Service-providingindustries.................141.4144.7145.60.90.70.63.83.33.0Nonunion...........................................138.0140.9141.60.80.40.52.92.92.6Goods-producingindustries.................137.3140.5140.91.00.90.33.43.32.6Manufacturing................................137.4140.5140.90.70.60.33.22.92.5Service-providingindustries.................138.2141.0141.80.80.20.62.82.82.6CensusregionanddivisionNortheast..........................................139.8142.7143.10.70.60.33.32.82.4NewEngland...................................145.4147.8148.71.20.50.62.92.92.3MiddleAtlantic..................................137.8140.8141.10.70.60.23.52.82.4South...............................................136.7139.7140.10.90.90.32.83.12.5SouthAtlantic...................................139.1142.2142.70.91.30.43.03.12.6EastSouthCentral.............................135.6137.8138.01.60.50.13.13.31.8WestSouthCentral............................133.2136.2136.50.80.60.22.33.02.5Midwest............................................135.0137.9138.70.7-0.20.62.72.92.7EastNorthCentral.............................133.4136.3137.00.8-0.70.52.92.92.7WestNorthCentral............................139.1142.0142.80.90.90.62.73.02.7West................................................141.4144.3145.80.90.01.03.12.93.1Mountain........................................139.0141.8142.81.10.70.73.63.12.7Paci®c...........................................142.5145.5147.10.8-0.21.13.02.93.2Includesmining,construction,andmanufacturing.Includesthefollowingindustries:wholesaletrade;retailtrade;transportationandwarehousing;utilities;information;®nanceandinsurance;realestateandrentalandleasing;professionalandtechnicalservices;managementofcompaniesandenterprises;administrativeandwasteservices;educationalservices;healthcareandsocialassistance;arts,entertainmentandrecreation;accommodationandfoodservices;andotherservices,exceptpublicadministration.TheCensusdivisionsarede®nedasfollows:NewEngland:Connecticut,Maine,Massachusetts,NewHampshire,RhodeIslandandVermont;MiddleAtlantic:NewJersey,NewYork,andPennsylvania;SouthAtlantic:Delaware,DistrictofColumbia,Florida,Georgia,Maryland,NorthCarolina,SouthCarolina,Virginia,andWestVirginia;EastSouthCentral:Alabama,Kentucky,Mississippi,andTennessee;WestSouthCentral:Arkansas,Louisiana,Oklahoma,andTexas;EastNorthCentral:Illinois,Indiana,Michigan,Ohio,andWisconsin;WestNorthCentral:Iowa,Kansas,Minnesota,Missouri,Nebraska,NorthDakota,andSouthDakota;Mountain:Arizona,Colorado,Idaho,Montana,Nevada,NewMexico,Utah,andWyoming;andPaci®c:Alaska,California,Hawaii,Oregon,andWashington.NOTE:Theindexesfortheseseriesarenotstrictlycomparabletothosefortheaggregate,occupation,andindustryseries.SOURCE:U.S.BureauofLaborStatistics,NationalCompensationSurvey Table11.EmploymentCostIndexforwagesandsalaries,forstateandlocalgovernmentworkers,byoccupationalgroupandindustry[Notseasonallyadjusted]OccupationalgroupandindustryIndexes(Dec.2005=100)Percentchangesfor-3-monthsended-12-monthsended-Allworkers...........................................132.5134.0134.91.50.20.72.72.61.8OccupationalgroupManagement,professional,andrelated.......131.6133.0133.91.50.30.72.72.51.7Professionalandrelated......................131.4132.8133.81.50.30.82.82.61.8Salesandoffice...................................132.4134.0134.91.30.30.72.72.51.9Officeandadministrativesupport............132.9134.5135.41.30.30.72.82.51.9Serviceoccupations..............................135.6137.6138.41.30.40.63.02.82.1Educationandhealthservices..................131.7133.0134.01.60.30.82.72.61.7Educationalservices...........................131.3132.3133.51.80.30.92.92.61.7Schools.......................................131.2132.3133.51.70.30.92.82.61.8Elementaryandsecondaryschools....130.8131.8133.31.90.31.12.82.71.9Healthcareandsocialassistance...........135.9138.2138.51.00.20.22.62.81.9Hospitals......................................134.5137.2137.51.10.20.22.63.12.2Publicadministration.............................133.4135.5135.90.90.30.32.72.51.9SOURCE:U.S.BureauofLaborStatistics,NationalCompensationSurvey Table12.EmploymentCostIndexforbene®ts,byoccupationalgroup,industry,andbargainingstatus[Notseasonallyadjusted]Occupationalgroup,industry,andbargainingIndexes(Dec.2005=100)Percentchangesfor-3-monthsended-12-monthsended-CivilianworkersAllworkers........................................140.7143.0143.90.60.60.62.32.22.3PrivateindustryworkersAllworkers.........................................135.8138.0138.50.40.80.42.02.02.0OccupationalgroupManagement,professional,andrelated.......134.5136.3136.90.40.70.42.11.81.8Salesandoffice...................................137.6139.8140.10.31.00.22.11.91.8Naturalresources,construction,andmaintenance....................................138.7140.7141.20.70.70.41.62.21.8Production,transportation,andmaterialmoving...........................................136.1138.9139.50.30.90.41.92.42.5Serviceoccupations..............................134.8137.4138.00.20.80.41.92.22.4Goods-producingindustries....................132.3133.9134.20.50.70.22.31.71.4Manufacturing..................................131.7133.4133.50.50.90.12.21.81.4Aircraftmanufacturing......................99.395.696.30.11.30.70.8-3.6-3.0Service-providingindustries....................137.2139.5140.10.40.80.41.92.02.1BargainingstatusUnion...............................................146.9150.3151.1-0.11.60.51.42.22.9Nonunion...........................................133.6135.6136.00.50.70.32.12.01.8StateandlocalgovernmentworkersAllworkers.........................................158.5161.4163.61.30.31.43.53.13.2Includesworkersintheprivatenonfarmeconomyexceptthoseinprivatehouseholds,andworkersinthepublicsector,exceptthefederalIncludesmining,construction,andmanufacturing.Includesthefollowingindustries:wholesaletrade;retailtrade;transportationandwarehousing;utilities;information;®nanceandinsurance;realestateandrentalandleasing;professionalandtechnicalservices;managementofcompaniesandenterprises;administrativeandwasteservices;educationalservices;healthcareandsocialassistance;arts,entertainmentandrecreation;accommodationandfoodservices;andotherservices,exceptpublicadministration.SOURCE:U.S.BureauofLaborStatistics,NationalCompensationSurvey Table13.EmploymentCostIndexfortotalcompensationandwagesandsalaries,forprivateindustryworkersbyarea[Notseasonallyadjusted]Censusregionandmetropolitanarea12-monthpercentchanges-TotalcompensationWagesandsalariesBoston-Worcester-Providence,MA-RI-NH-CTCSA............2.7NewYork-Newark,NY-NJ-CT-PACSA..........................3.8Philadelphia-Reading-Camden,PA-NJ-DE-MDCSA...........1.7Atlanta-Athens-ClarkeCounty-SandySprings,GACSA.......3.3Dallas-FortWorth,TX-OKCSA...................................2.3Houston-TheWoodlands,TXCSA...............................1.7Miami-FortLauderdale-PortSt.Lucie,FLCSA.................2.2Washington-Baltimore-Arlington,DC-MD-VA-WV-PACSA....2.4Chicago-Naperville,IL-IN-WICSA................................2.3Detroit-Warren-AnnArbor,MICSA...............................2.8Minneapolis-St.Paul,MN-WICSA................................3.1LosAngeles-LongBeach,CACSA...............................3.7Phoenix-Mesa-Scottsdale,AZMSA..............................3.6SanJose-SanFrancisco-Oakland,CACSA.....................2.4Seattle-Tacoma,WACSA.........................................2.4TheseareasincludeConsolidatedStatisticalAreas(CSAs)andMetropolitanStatisticalAreas(MSAs).BeginningwiththeDecember2018release,areade®nitionsarebasedonOfficeofManagementandBudgetBulletinNo.13-01,datedFebruary28,2013.Previousareade®nitionsarebasedonOfficeofManagementandBudgetBulletinNo.04-03,datedFebruary18,2004.Formoreinformationonmetropolitanareade®nitions,seeIncludeswages,salaries,andemployercostsforemployeebene®ts.SOURCE:U.S.BureauofLaborStatistics,NationalCompensationSurvey -2 - Chart 5. Twelve month percent change, not seasonally adjusted, state and local governmentworkers increases for in Spercent for related occupations o 3.7 percent for ervice cupations. Withinindustry supersectors,ompensation cost ncreases angefrom 2.1 percent ducation and health services percentfor leisur hospitality.(See table 5.) Compensation costs for state and local government workers increased 2.3 percent for the 12-month period ending in September 2020, compared with an increase of 3.1 percentSeptemberWages and salaries increased percent for the 12-month period ending in Septemberandpercent a year agoBenefit costs ncreased percent for the 12-month period ending in September 2020. The prior year increase was percent. (See chart 5 and tables A, 7, 11, and 12.) Chart 4. Twelvemonth percent change, not seasonally adjusted, private industryworkers Chart 3. Twelve month percent change, not seasonally adjusted, private industryworkers 0.01.02.03.04.05.0201520162017201820192020 Health benefits Benefits 0.01.02.03.04.05.0201520162017201820192020 Wages and salaries Benefits 0.01.02.03.04.05.0201520162017201820192020 Wages and salaries Benefits Coronavirus (COVID-19) PandemicmpactSeptember2020 Employment ost ndex The mployment ost ndex (ECI) eference te as September 12, 2020. Response ates eptember Transmission of materialthis releaseis embargoed until USDL-20-1998 8:30 a.m. ) FridayOctober 30 Technical information: (202) 691-6199ncsinfo@bls.govwww.bls.gov/ectMediacontact: (202) 691-5902pressoffice@bls.gov MPLOYMENT OSTNDEXSeptember2020 Compensation costs for civilian workers increased 0.5 percent, seasonally adjusted, for the 3-month period ending in September 2020, the U.S. Bureau of Labor Statistics reported today. Wages and salariesincreased 0.4 percent and benefit costsincreased percentfrom June 2020. (See chart 1 and tables A, 1, 2, and 3.) Compensation costs for civilian workers increased 2.4 percent for the 12-month period ending in Septemberand increased 2.8 percent in SeptemberWages and salaries increased percent over the yearandincreased 2.9 percent for the 12-month period ending in SeptemberBenefit costs increased 2.3 percent and also increasepercent for the 12-month period ending in September 2019. (See chart 2 and tables A, 4, 8, and 12.) Compensation costsforprivate industry workers increased 2.4 percent over the y. InSeptember2019, the increase was 2.7 percentWages and salaries increased 2.7 percent for the 12-month period ending in Septemberand increased 3.0 percent in September 2019. The cost of benefits rose percent for the 12-month period ending in September 2020 andalsoincreasedpercent in September 2019. (See charts 3 and 4 and tables A, 5, 9, and 12.) Employer costs for health benefits increased 1.8 percent for the 12-month period ending in September 2020. (For further information, see chart 3 and www.bls.gov/web/eci/echealth.pdf.) Chart 1. Three month percent change, seasonally adjusted civilian workers total compensation 0.00.20.40.60.81.0201520162017201820192020 0.01.02.03.04.05.0201520162017201820192020 Wages and salaries Benefits Chart 2. Twelve month percent change, not seasonally adjusted , civilian workers