/
Exhibit 1. Exhibit 1.

Exhibit 1. - PowerPoint Presentation

debby-jeon
debby-jeon . @debby-jeon
Follow
391 views
Uploaded On 2016-02-20

Exhibit 1. - PPT Presentation

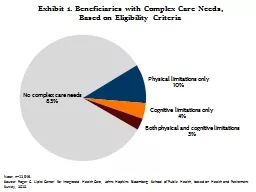
Beneficiaries with Complex Care Needs Based on Eligibility Criteria Note n12549 Source Roger C Lipitz Center for Integrated Health Care Johns Hopkins Bloomberg School of Public Health based on Health and Retirement Survey ID: 224477

complex care medicare health care complex health medicare 200 fpl based income annual dual 2010 exhibit survey eligibles average

Share:

Link:

Embed:

Download Presentation from below link

Download Presentation The PPT/PDF document "Exhibit 1." is the property of its rightful owner. Permission is granted to download and print the materials on this web site for personal, non-commercial use only, and to display it on your personal computer provided you do not modify the materials and that you retain all copyright notices contained in the materials. By downloading content from our website, you accept the terms of this agreement.


Presentation Transcript

Slide1

Exhibit 1. Beneficiaries with Complex Care Needs, Based on Eligibility Criteria

Note: n=12,549.

Source: Roger C. Lipitz Center for Integrated Health Care, Johns Hopkins Bloomberg School of Public Health, based on Health and Retirement Survey, 2010.

No complex care needs83%

Physical limitations only10%

Cognitive limitations only4%

Both physical and cognitive limitations

3%Slide2

Exhibit 2. Income Distribution of Beneficiaries with Complex Care Needs and Those Without, Across Income and Insurance Categories

Notes: FPL refers to federal poverty level. No complex care needs: n=9,279. Complex care needs: n=1,972.

Source: Roger C. Lipitz Center for Integrated Health Care, Johns Hopkins Bloomberg School of Public Health, based on Health and Retirement Survey, 2010.

Complex care needsDual

eligibles

No complex care needs

10%

65%

25%

32%

38%

30%

>200% FPL

<200% FPLSlide3

Exhibit 3. Mean (Median) Annual Medicare and Out-of-Pocket Spending for Community-Dwelling Traditional Medicare Beneficiaries, 2010

Note: Out-of-pockets costs are based on a two-year period and recalculated for annual average estimates. Household income includes respondent and spouse only. Dual

eligibles qualify for Medicare and Medicaid. FPL refers to federal poverty level.Source: Roger C. Lipitz

Center for Integrated Health Care, Johns Hopkins Bloomberg School of Public Health, based on Health and Retirement Survey, 2010, matched with Medicare records.

All Medicare

(n=10,638)No complex care needs

(n=8,836)

Complex care needs

(n=1,802)

All Medicare

$7,013 ($1,140)

$5,754 ($978)

$13,188 ($3,137)

Dual

eligibles

$11,058 ($2,491)

$8,358 ($1,706)

$15,268 ($5,097)

<200% FPL

$5,360 ($710)

$4,404 ($627)

$8,965 ($1,115)

>200%

FPL

$5,427 ($1,010)

$4,652 ($940)

$11,536 ($2,280)

Average annual Medicare

spending

All Medicare(n=7,989)No complex care needs(n=6,767)Complex care needs(n=1,222)All Medicare8.35% (2.15%)6.73% (1.98%)17.26% (3.73%)Dual eligibles6.52% (2.35%)6.13% (2.19%)7.31% (2.63%)<200% FPL21.06% (4.06%)16.79% (3.86%)38.62% (5.50%)>200% FPL3.60% (1.70%)3.23% (1.59%)6.70% (3.35%)

Average annual

out-of-pocket spending as a percentage of household income