PPT-Sect. 2-3 Graphing Polynomial Functions

Author : debby-jeon | Published Date : 2016-11-23

Objectives Identify Polynomial functions Determine end behavior recognize characteristics of polynomial functions Use factoring to find zeros of polynomial functions

Presentation Embed Code

Download Presentation

Download Presentation The PPT/PDF document "Sect. 2-3 Graphing Polynomial Functions" is the property of its rightful owner. Permission is granted to download and print the materials on this website for personal, non-commercial use only, and to display it on your personal computer provided you do not modify the materials and that you retain all copyright notices contained in the materials. By downloading content from our website, you accept the terms of this agreement.

Sect. 2-3 Graphing Polynomial Functions: Transcript


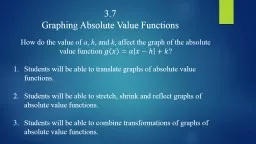
Objectives Identify Polynomial functions Determine end behavior recognize characteristics of polynomial functions Use factoring to find zeros of polynomial functions Polynomials of degree 2 or higher have graphs that are smooth and continuous By smooth we mean the graphs have rounded curves with no sharp corners By continuous we mean the graphs have no breaks and can be drawn without lifting your pencil from the rectangular coordinate system. Mrs. . Chernowski. Pre-Calculus. Chris Murphy. Requirements:. At least 3 relative maxima and/or minima. The ride length must be at least 4 minutes. The coaster ride starts at 250 feet. The ride dives below the ground into a tunnel at least once. University of Michigan – Dearborn Science Learning Center. Based on a presentation by James . Golen. Revised by Annette . Sieg. …. Introduction. Before using this module you must already understand the basics of graphing (e.g., identifying dependent and independent variables, plotting data points). . Algebra II with . Trigonometry. Ms. Lee. Essential Question. What is a polynomial?. How do we describe its end behavior?. How do we add/subtract polynomials?. Essential Vocabulary. Polynomial . Degree. Evaluating Rational & Irrational Exponents. Graphing Exponential Functions . f(x) = a. x. Equations with . x. and . y. Interchanged. Applications of Exponential Functions. Use calculators to calculate graphing points. Classify polynomials and write polynomials in standard form. . Evaluate . polynomial expressions. .. Add and subtract polynomials. . Objectives. monomial. degree of a monomial. polynomial. degree of a polynomial.  . An order . differential equation has a . parameter family of solutions … or will it?.  . 0. 1. 2. 3. 4. 0. 0. 1. 2. 3. 4. 1. 1. 2. 3. 4. 0. 2. 2. 3. 4. 0. 1. 3. 3. 4. 0. 1. 2. 4. 4. 0. 1. 2. Algebra 2. Chapter 5. This Slideshow was developed to accompany the textbook. Larson Algebra 2. By Larson. , R., Boswell, L., . Kanold. , T. D., & Stiff, L. . 2011 . Holt . McDougal. Some examples and diagrams are taken from the textbook.. Definitions. Coefficient. : the numerical factor of each term.. Constant. : the term without a variable.. Term. : a number or a product of a number and variables raised . to a power.. Polynomial. : a finite sum of terms of the form . How do the value of . a. , . h. , and . k. , affect the graph of the absolute value function . ?. Students will be able to translate graphs of absolute value functions.. Students will be able to . stretch, shrink and reflect graphs of absolute value functions.. Now, we have learned about several properties for polynomial functions. Finding y-intercepts. Finding x-intercepts (zeros). End behavior (leading coefficient, degree). Testing values for zeros/factors (synthetic division) . Section 2.4. Terms. Divisor: . Quotient: . Remainder:. Dividend: . PF. FF .  . Long Division. Use long division to find . divided by . ..  . Division Algorithm for Polynomials. Let . and . be polynomials with the degree of . Standard 15. Graph and analyze polynomial and radical functions to determine:. Domain and range. X and y intercepts. Maximum and minimum values. Intervals of increasing and decreasing. End behavior. With the function: f(x) = . ••»••••• Online Polynomial Regression HomeContents LR LnR ExpR PowR PR MLR MPR NLR More...Contact This page allows performing polynomial regressions (polynomial l Algebra 2. Chapter 4. This Slideshow was developed to accompany the textbook. Big Ideas Algebra 2. By Larson, R., Boswell. 2022 K12 (National Geographic/Cengage). Some examples and diagrams are taken from the textbook..

Download Document

Here is the link to download the presentation.
"Sect. 2-3 Graphing Polynomial Functions"The content belongs to its owner. You may download and print it for personal use, without modification, and keep all copyright notices. By downloading, you agree to these terms.

Related Documents