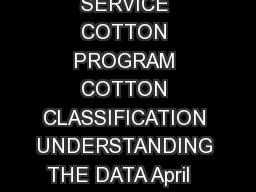
/
UNITED STATES DEPARTMENT OF AGRICULTURE AGRICULTURAL MARKETING SERVICE COTTON PROGRAM UNITED STATES DEPARTMENT OF AGRICULTURE AGRICULTURAL MARKETING SERVICE COTTON PROGRAM

UNITED STATES DEPARTMENT OF AGRICULTURE AGRICULTURAL MARKETING SERVICE COTTON PROGRAM - PDF document

debby-jeon
debby-jeon . @debby-jeon
Follow
616 views
Uploaded On 2014-10-29

UNITED STATES DEPARTMENT OF AGRICULTURE AGRICULTURAL MARKETING SERVICE COTTON PROGRAM - PPT Presentation

All instrument measurements currently utilized in USDA Upland cotton classi fication are from Uster High Volume Instrument HVI systems Classification for Pima cotton consists of classer color and leaf grades extraneous matter if any and instrument m ID: 8991

All instrument measurements currently

Share:

Link:

Embed:

Download Presentation from below link

Download Pdf The PPT/PDF document "UNITED STATES DEPARTMENT OF AGRICULTURE ..." is the property of its rightful owner. Permission is granted to download and print the materials on this web site for personal, non-commercial use only, and to display it on your personal computer provided you do not modify the materials and that you retain all copyright notices contained in the materials. By downloading content from our website, you accept the terms of this agreement.


Presentation Transcript

UNITED STATES DEPARTMENT OF AGRICULTURE AGRICULTURAL MARKETING SERVICE COTTON PROGRAM UNDERSTANDING THE DATA April 2005 - 1 - USDA, AMS, COTTON PROGRAM UNIVERSAL CLASSIFICATION DATA FORMAT (Applicable to All Methods of Data Dissemination for Form 1 Classification Offered by the Cotton Program) FIELD NAME Gin Code Number 01-05 Gin Bale Number 06-12 Date Classed 13-20 Module, Trailer, or Single Bale 21 Module/Trailer Number 22-26 Bales in Module/Trailer 27-28 Official Color Grade 29-30 of an inch) 31-32 Micronaire 33-34 Strength (grams/tex) 35-37 Leaf Grade 38 Extraneous Matter 39-40 Remarks 41-42 Instrument Color Grade 43-44 Color Quadrant 45 Color Rd 46-48 Color +b 49-51 Non-Lint Content (Trash Percent Surface) 52-53 of an inch) 54-56 Length Uniformity Index (percent) 57-59 Upland or Pima 60 Record Type 61 Record Status 62 CCC Loan Premiums and Discounts 63-67 - 3 - Module/Trailer Number (Columns 22-26) A five-digit number identifies the module/trailer number assigned at the gin. Bales in Module/Trailer A two-digit number identifies the number of bales in the module/trailer that were released The official Upland color grade that appears on the classification record is determined byinstrument based measurements. Color refers to the gradations of grayness and yellowness in the cotton. The official Pima color grade that appears on the classification record is determined by a human classer. Certain special condition codes listed below on this page are shown in the color grade columns for Upland and Pima. Codes that identify extraneous matter and other special condition cotton are shown in the extraneous matter and remarks section as shown on Page 6. The codes that identify American Upland and 11, 21, 31, 41, 51, 61, 71, 81 12, 22, 32, 42, 52, 62, 82 13, 23, 33, 43, 53, 63, 83 24, 34, 44, 54, 84 25, 35, 85 1, 2, 3, 4, 5, 6, 7 Special Condition Codes for Upland Cotton 96 Mixture of Upland and Pima 97 Fire Damaged 98 Water Damaged Special Condition Codes for Pima Cotton 93 Mixture of Pima and Upland 94 Fire Damaged 95 Water Damaged - 5 - Strength (grams/tex) The fiber strength measurement is made by clamping and breaking a bundle of fibers with a 1/8-inch spacing between the clamp jaws. Results are reported in terms of grams per tex to the nearest tenth. A tex unit is equal to the weight in grams of 1,000 meters of fiber. Therefore, the strength reported is the force in grams required to break a bundle of fibers one tex unit in size. The following table shows some general descriptions of strength Designation (grams per tex) Weak 23.0 & below Intermediate 24.0 – 25.0 Average 26.0 – 28.0 Strong 29.0 – 30.0 Very Strong 31.0 & above Leaf Grade Leaf refers to small particles of the cotton plant’s leaf which remain in the lint after the ginning process. Upland leaf grades are determined by the classer and are identified as numbers 1 through 7, all represented by physical standards. Upland leaf grade 8 (Below Grade) is used to identify samples having more leaf than leaf grade 7. American Pima leaf grades are also determined by the classer and represented by physical standards, and leaf grade 7 (Below Grade), which is used to Extraneous matter is any substance in the cotton other than fiber or leaf. Examples of extraneous matter are bark, grass, spindle twist, seed coat fragments, dust, and oil. The kind of extraneous matter, and an indication of the amount (light or heavy), are noted by the classer on the classification record. The amount of extraneous matter in the cotton is reported as level 1 or level 2, with level 2 indicating the heavier contamination. The code and level of extraneous matter in a sample are as follows: The color diagram for color grades of American Pima cotton on page 13 is based on the official standards for American Pima cotton. Color grades shown in the chart are the one-digit color grades of American Pima. Two digits are shown on the classification record, the cation record is the percent of the sample surface covered by trash particles as determined by image analysis. For example, a reading of 04 indicates that trash particles cover 0.4 percent of the sample surface. Trash particles include extraneous matter such as grass, bark, etc., but these particles cannot be distinguished one from another by this measurement. Therefore, the classer will continue Length Uniformity Index (Percent) Length uniformity index is a three-digit number that is a measure of the degree of uniformity of the fibers in a sample to the nearest tenth (the decimal is not displayed). The descriptive Descriptive Designation Length Uniformity Very Low Below 76.5 Low 76.5 – 79.4 Average 79.5 – 82.4 High 82.5 – 85.4 Very High Above 85.4 Upland or Pima 1 = Upland 2 = Pima Record Type 0 = Original 1 = Review 2 = Rework - 9 - Module/Trailer Averaging Fact Sheet The Cotton Program first offered Module/Trailer Averaging to the cotton industry in 1991 as a means to improve the accuracy of instrument strength readings. The success of this 1991 pilot project resulted in increased iModule/Trailer Averaging to include additional instrument measurements for the 1992 and 1993 crops. Beginning with the 1994 crop, Module/Trailer Averaging included only the quality factors of mike, strength, length, and length uniformity. Results from this project improves the laboratory-to-laboratory reproducibility of instrument measurements. The Cotton Program continues to offer Module/Trailer Averaging to the cotton industry on a voluntary basis for the measurements of micronaire, strength, length, and length uniformity. Listed below are Classed by USDA 1991 99 1.2 million 8 1992 212 2.2 million 15 1993 242 3.1 million 20 1994 304 4.8 million 24 1995 251 3.8 million 22 1996 230 3.8 million 21 1997 198 3.6 million 20 1998 179 2.4 million 18 1999 174 3.1 million 19 2000 188 3.4 million 20 2001 186 3.7 million 19 2002 184 3.4 million 20 2003 210 4.1 million 23 2004 200 5.2 million 24 Reproducibility (Five Year Production 2000-2004) Reproducibility of Reproducibility Quality Assurance Averaging vs. QAPercent Reproducibility By Using Module/Trailer Micronaire 82 87 6.0 Strength 76 89 17.1 Length 81 92 13.5 87 96 10.3 Reproducibility Tolerances Quality Factor Tolerance (+ or -) 2003 & Previous 2004 & Later Micronaire 0.1 .15 Strength 1.5 1.5 Length 0.02 .025 Length Uniformity Index 1.0 1.5