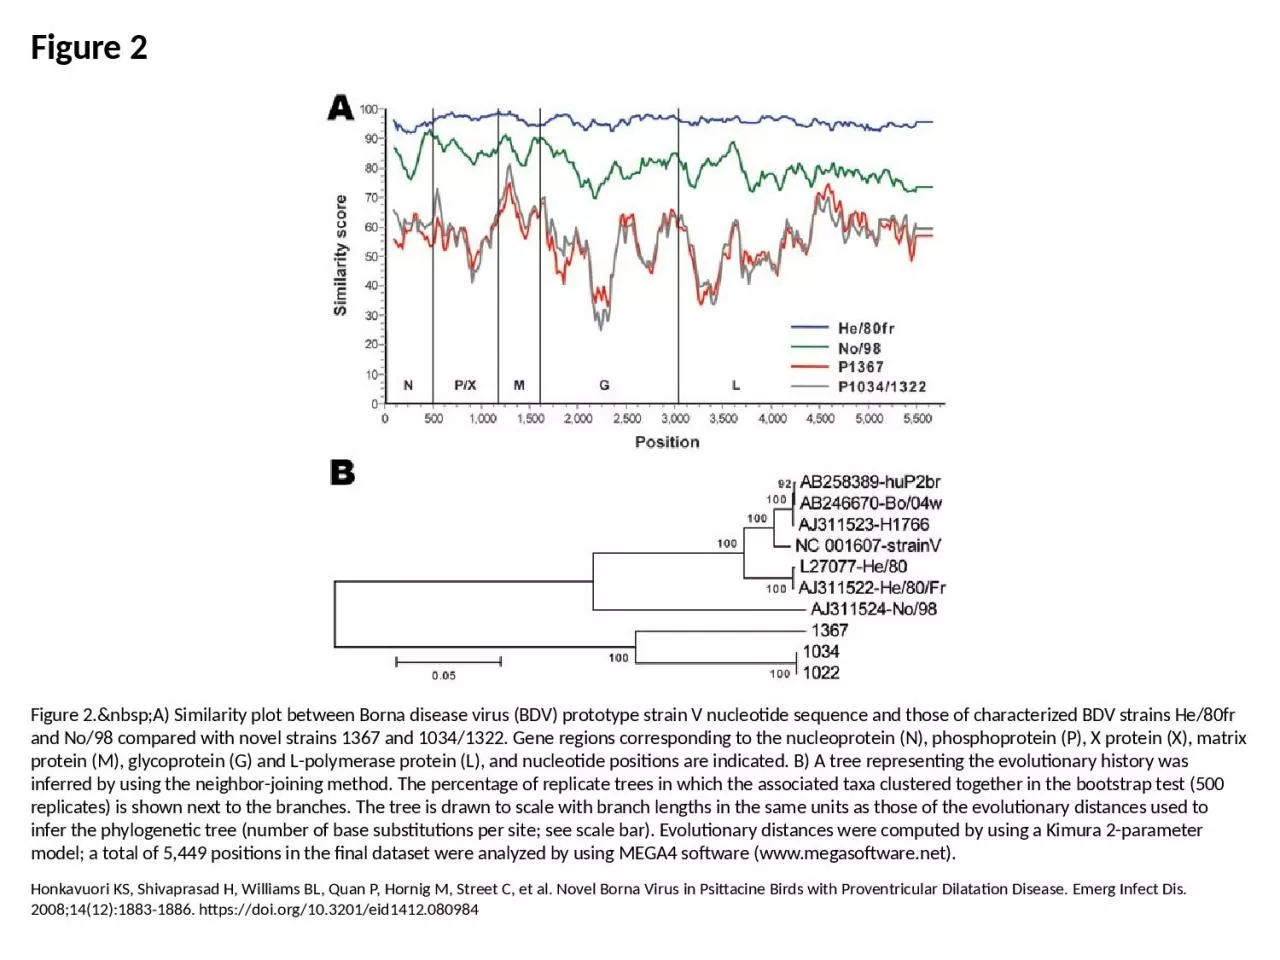
/
Figure 2 Figure 2. A) Similarity plot between Borna disease virus (BDV) prototype Figure 2 Figure 2. A) Similarity plot between Borna disease virus (BDV) prototype

Figure 2 Figure 2. A) Similarity plot between Borna disease virus (BDV) prototype - PowerPoint Presentation

dora
dora . @dora
Follow
27 views
Uploaded On 2024-02-09

Figure 2 Figure 2. A) Similarity plot between Borna disease virus (BDV) prototype - PPT Presentation

Honkavuori KS Shivaprasad H Williams BL Quan P Hornig M Street C et al Novel Borna Virus in Psittacine Birds with Proventricular Dilatation Disease Emerg Infect Dis 2008141218831886 httpsdoiorg103201eid1412080984 ID: 1044897

tree protein bdv evolutionary protein tree evolutionary bdv positions scale borna disease virus distances strains nucleotide

Share:

Link:

Embed:

Download Presentation from below link

Download Presentation The PPT/PDF document "Figure 2 Figure 2. A) Similarit..." is the property of its rightful owner. Permission is granted to download and print the materials on this web site for personal, non-commercial use only, and to display it on your personal computer provided you do not modify the materials and that you retain all copyright notices contained in the materials. By downloading content from our website, you accept the terms of this agreement.


Presentation Transcript

1. Figure 2Figure 2. A) Similarity plot between Borna disease virus (BDV) prototype strain V nucleotide sequence and those of characterized BDV strains He/80fr and No/98 compared with novel strains 1367 and 1034/1322. Gene regions corresponding to the nucleoprotein (N), phosphoprotein (P), X protein (X), matrix protein (M), glycoprotein (G) and L-polymerase protein (L), and nucleotide positions are indicated. B) A tree representing the evolutionary history was inferred by using the neighbor-joining method. The percentage of replicate trees in which the associated taxa clustered together in the bootstrap test (500 replicates) is shown next to the branches. The tree is drawn to scale with branch lengths in the same units as those of the evolutionary distances used to infer the phylogenetic tree (number of base substitutions per site; see scale bar). Evolutionary distances were computed by using a Kimura 2-parameter model; a total of 5,449 positions in the final dataset were analyzed by using MEGA4 software (www.megasoftware.net).Honkavuori KS, Shivaprasad H, Williams BL, Quan P, Hornig M, Street C, et al. Novel Borna Virus in Psittacine Birds with Proventricular Dilatation Disease. Emerg Infect Dis. 2008;14(12):1883-1886. https://doi.org/10.3201/eid1412.080984