/
Superstorm Sandy: Geophysical and Human Activities Impacts Superstorm Sandy: Geophysical and Human Activities Impacts

Superstorm Sandy: Geophysical and Human Activities Impacts - PowerPoint Presentation

dorothy
dorothy . @dorothy
Follow
66 views
Uploaded On 2023-05-20

Superstorm Sandy: Geophysical and Human Activities Impacts - PPT Presentation

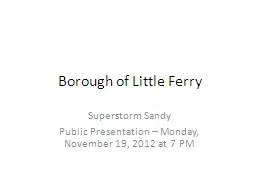
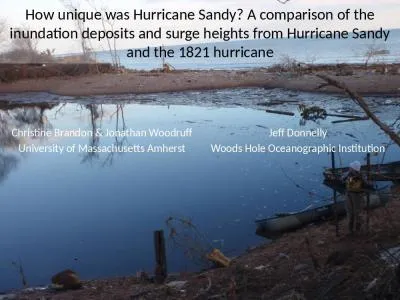
Theo Kioussis amp Patrick Fullerton Hampton Direct Broadcast Workshop 09 June 2017 Background What became known as Superstorm Sandy formed in the Caribbean on October 22 2012 as a tropical depression ID: 998372

dnb sandy data viirs sandy dnb viirs data 2012 land cuba hurricane www identify human features october livescience access

Share:

Link:

Embed:

Download Presentation from below link

Download Presentation The PPT/PDF document "Superstorm Sandy: Geophysical and Human ..." is the property of its rightful owner. Permission is granted to download and print the materials on this web site for personal, non-commercial use only, and to display it on your personal computer provided you do not modify the materials and that you retain all copyright notices contained in the materials. By downloading content from our website, you accept the terms of this agreement.


Presentation Transcript

1. Superstorm Sandy: Geophysical and Human Activities ImpactsTheo Kioussis & Patrick FullertonHampton Direct Broadcast Workshop09 June, 2017

2. BackgroundWhat became known as “Superstorm Sandy” formed in the Caribbean on October 22, 2012 as a tropical depressionStruck Eastern Cuba on October 25, 2012 as a Category 3 HurricaneStruck the Eastern U.S on October 29, 2012 near Atlantic City, New JerseyWreaked havoc on much of the U.S’s east coast as well as Caribbean Islands

3.

4. Preliminary Hypotheses:We will be able to identify a difference in land features before and after the storm as a result of land scarring and flooding wrought by the stormWe will identify effects on human structures/activitiesSuch things as power outages, instances of boating

5. Methods:The VIIRS DNB is useful for assessing the storm’s impact on human activitiesMODIS bands 1 & 2 were most useful for viewing surface and land features in assessing for land scarring/flooding

6. Boats: VIIRS DNB 10/28/12

7. VIIRS DNB 10/28/12

8. VIIRS DNB image of Cuba 10/28/12

9. VIIRS DNB Image of Cuba Last Night

10. “This is a disaster of major proportions,” Haitian Prime Minister Laurent Lamothe told the Associated Press. “The whole south is under water.” (Ferreira)Sandy Aftermath in Haiti/Dominican RepublicHaiti/D.R Yesterday

11. Conclusions:One cannot always access the data that one wants toThe data that is available isn’t always perfectWe were, however, able to identify some of the features that we sought, demonstrating that the available data is quite useful

12. Where to go from Here:Cross-referencing dataArchived data: something more than we have access to?We would prefer a before and after approach, as was the initial intention

13. Consulted Works:https://www.livescience.com/40774-hurricane-sandy-s-impact-infographic.htmlhttps://www.weather.gov/images/okx/Sandy/Track_NHCreport.pnghttps://www.livescience.com/24380-hurricane-sandy-status-data.htmlhttp://world.time.com/2012/10/29/in-haiti-hurricane-sandy-leaves-behind-death-and-devastation/