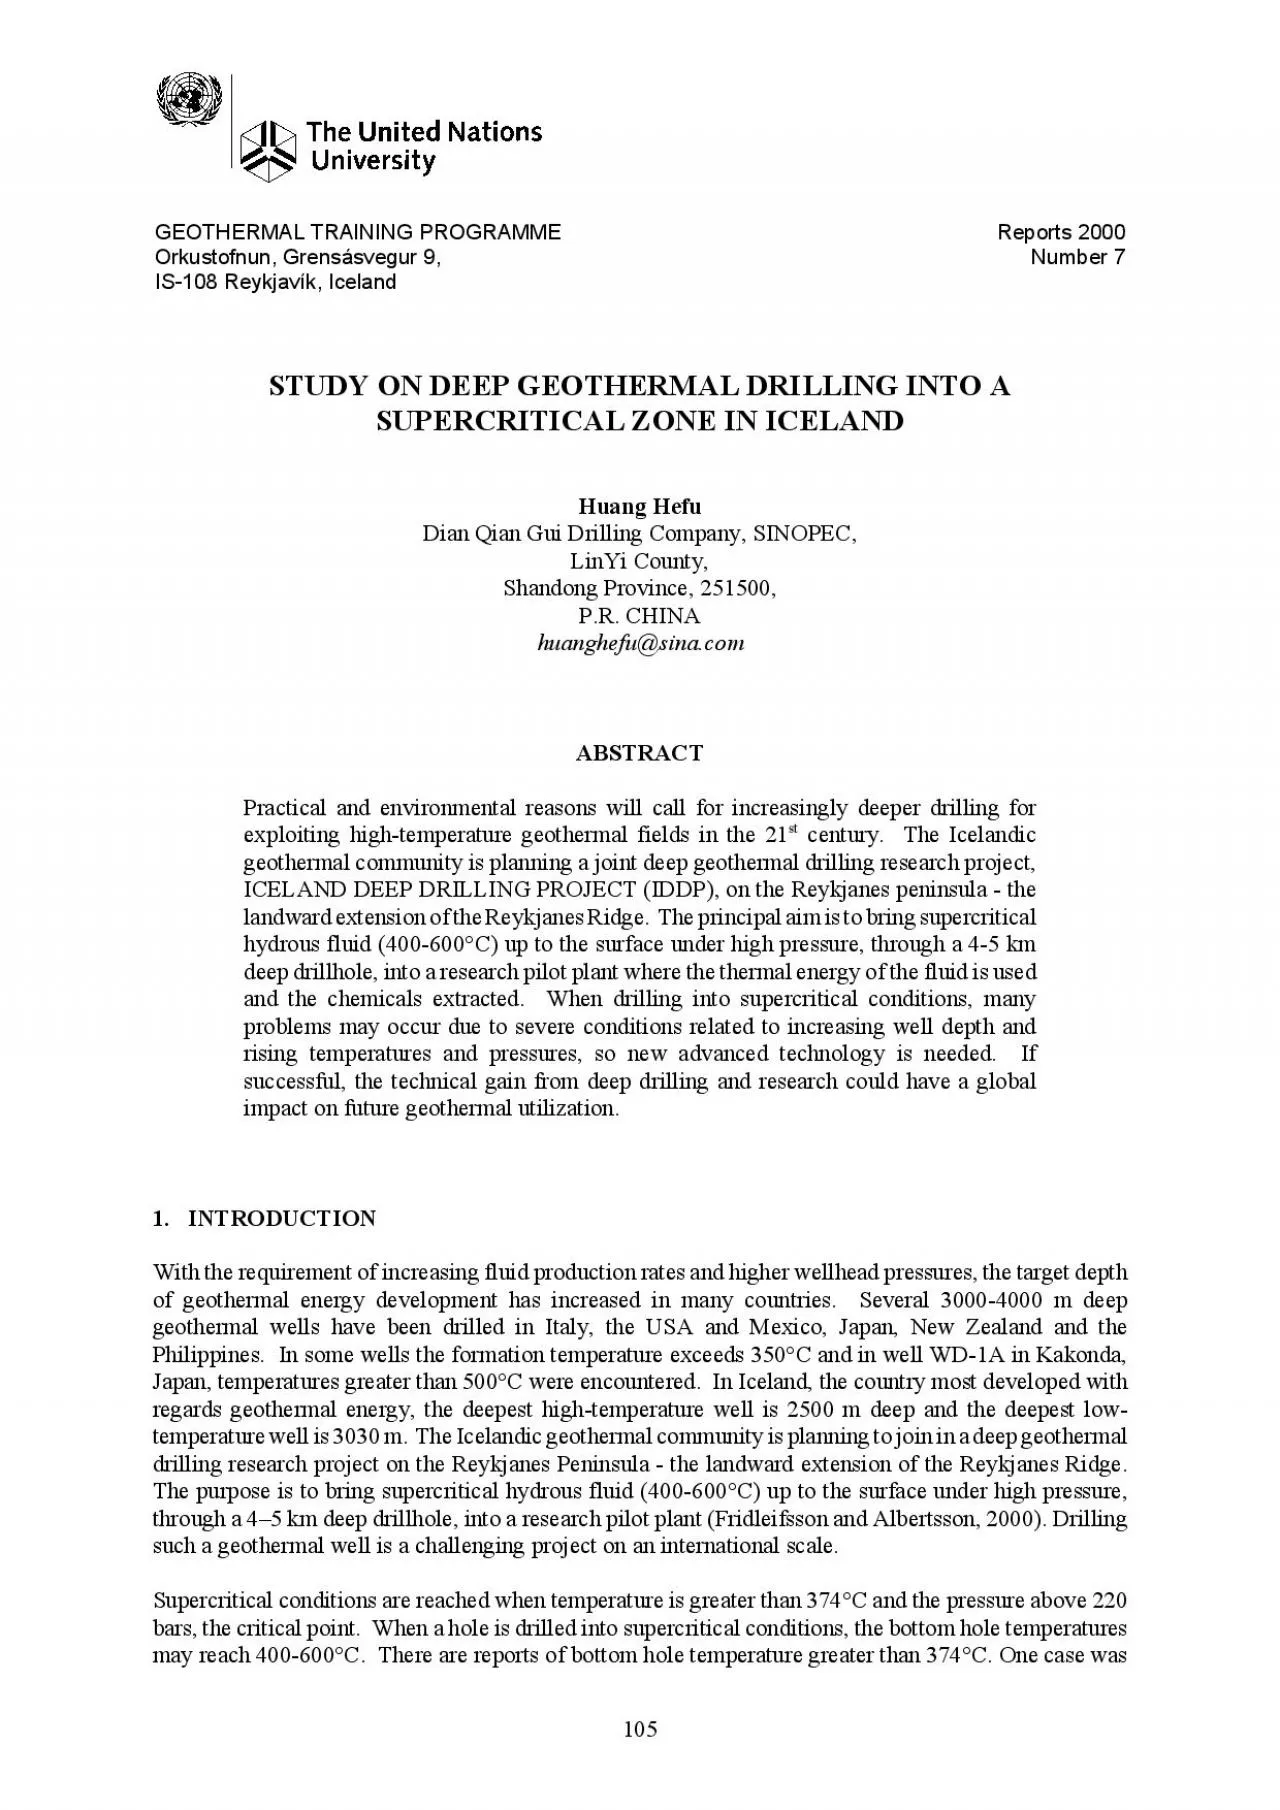
/
GEOTHERMAL TRAINING PROGRAMMEReports 2000Orkustofnun Grenssvegur 9Numb GEOTHERMAL TRAINING PROGRAMMEReports 2000Orkustofnun Grenssvegur 9Numb

GEOTHERMAL TRAINING PROGRAMMEReports 2000Orkustofnun Grenssvegur 9Numb - PDF document

elina
elina . @elina
Follow
344 views
Uploaded On 2021-09-11

GEOTHERMAL TRAINING PROGRAMMEReports 2000Orkustofnun Grenssvegur 9Numb - PPT Presentation

106Huang HefuReport 7locations of Reykjanes Nesjavellir and Krafla hightemperature fields are shownin Iceland in well NJ11 at Nesjavellir where the measured bottom hole temperatures was 380CAnother ID: 879171

casing temperature geothermal drilling temperature casing drilling geothermal high depth pressure water hole pipe temperatures circulation figure cement fluid

Share:

Link:

Embed:

Download Presentation from below link

Download Pdf The PPT/PDF document "GEOTHERMAL TRAINING PROGRAMMEReports 200..." is the property of its rightful owner. Permission is granted to download and print the materials on this web site for personal, non-commercial use only, and to display it on your personal computer provided you do not modify the materials and that you retain all copyright notices contained in the materials. By downloading content from our website, you accept the terms of this agreement.


Presentation Transcript

1 GEOTHERMAL TRAINING PROGRAMMEReports 200
GEOTHERMAL TRAINING PROGRAMMEReports 2000Orkustofnun, Grensásvegur 9,Number 7Dian Qian Gui Drilling Company, SINOPEC,LinYi County,Practical and environmental reasons will call for increasingly deeper drilling forexploiting high-temperature geothermal fields in the 21 century. The Icelandicgeothermal community is planning a joint deep geothermal drilling research project,ICELAND DEEP DRILLING PROJECT (IDDP), on the Reykjanes peninsula - thelandward extension of the Reykjanes Ridge. The principal aim is to bring supercriticalhydrous fluid (400-600°C) up to the surface under high pressure, through a 4-5 kmdeep drillhole, into a research pilot plant where the thermal energy of the fluid is usedand the chemicals extracted. When drilling into supercritical conditions, manyproblems may occur due to severe conditions related to increasing well depth andrising temperatures and pressures, so new advanced technology is needed. Ifsuccessful, the technical gain from deep drilling and research could have a globalimpact on future geothermal utilization.With the requirement of increasing fluid production rates and higher wellhead pressures, the target depthof geothermal energy development has increased in many countries. Several 3000-4000 m deepgeothermal wells have been drilled in Italy, Philippines. In some wells the formation temperature exceeds 350°C and in well WD-1A in Kakonda,Japan, temperatures greater than 500°C were encountered. In Iceland, the country most developed withregards geothermal energy, the deepest high-temperature well is 2500 m deep and the deepest low-temperature well is 3030 m. The Icelandic geothermal community is planning to join in a deep geothermaldrilling research project on the Reykjanes Peninsula - the landward extension of the Reykjanes Ridge.The purpose is to bring supercritical hydrous fluid (400-600°C) up to the surface under high pressure,through a 4–5 km deep drillhole, into a research pilot plant (Fridleifsson and Albertsson, 2000). Drillingsuch a geothermal well is a challenging project on an international scale.Supercritical conditions are reached when temperature is greater than 374°C and the pressure above 220bars, the critical point. When a hole is drilled into supercritical conditions, the bottom hole temperaturesmay reach 400-600°C. There are reports of bottom hole temperature greater than 374°C. One case was 106Huang HefuReport 7 locations of Reykjanes, Nesjavellir and Krafla high-temperature fields are shownin Iceland, in well NJ-11 at Nesjavellir where the measured bottom

2 hole temperatures was 380°C.Another cas
hole temperatures was 380°C.Another case was reported in Hawaii; the well produced steam/fluid at surface at 374°C. Both wells werenot thought to be deep enough to reach supercritical conditions, but possibly intersected a fractureconnected to the supercritical fluid. A third case was reported in Japan, well WD-1A in Kakonda, wherethe formation temperature exceeded 500°C at 3700 m depth; this was one of the HDR (hot dry rock) wells.With increasing bottom hole temperatures, many downhole problems will occur. Cyclic steam stimulationcan impose severe stresses on the casing. If the temperature is high enough, the yield strength of thecasing materials will be exceeded and the casing will become plastically deformed or collapse, leadingto early casing damage. The high temperature and pressure can also lead to blowouts. Many downholetools and materials also have temperature limitations. How to estimate the bottom hole temperature andcool the well while drilling is important for successful drilling. This paper will assess some of theproblems to be encountered while drilling a well into the supercritical zone. How these critical problemsare dealt with is a key issue for success of high-temperature well drilling.Iceland is located in the Mid-AtlanticRidge region. The boundary between theEuropean and American plates is along theaxial rift zone running across Iceland. It ischaracterized by many volcanic systemsarranged en-echelon along the rift zone.Like other constructive plates margins theMid-Atlantic Ridge is characterized byhigh heat flow in the crustal region, butwith increasing distance symmetricallyaway from the ridge crest, the mean heatflow falls until it reaches an average levelof the oceans. Iceland forms a 500 kmbroad segment astride the ridge and fallsentirely within the crustal heat flowanomaly. The regional heat flow on theisland varies from about 80 mW/mfurthest away from the active volcaniczone crossing the country to about 300mW/m in some regions at the margins ofthe Reykjanes-Langjökull axial rift zoneHot springs are very abundant in thecountry as the result of the high heat flow.To date, approximately 1000 geothermallocalities in the country have beenrecognized. For the IDDP, only the betterstudied high-temperature systems, i.e. the Krafla-, Nesjavellir-, Svartsengi-, and the Reykjanes geothermalsystems are targeted. All four are already utilised, producing electricity with steam and/or producing hotwater for domestic use through heat exchangers. Of these four systems, the Svartsengi system

3 will notbe discussed further, as it is
will notbe discussed further, as it is probably the least suitable for deep research drilling for supercritical fluids.The Reykjanes system on the other hand, is much hotter and exploited on a limited scale at present, where high-quality salts are extracted from the high-temperature geothermal brine. Partly for these reasons theReykjanes system is the main candidate for the joint research programme (IDDP), financed by the mainenergy producers in Iceland, possibly with participation of an international consortium of researchers andequipment manufactures. This IDDP project was introduced at the World Geothermal Congress 2000 inReykjanes can be considered a natural drilling platform above a mid-ocean-ridge high-temperature system.Its seawater salinity, its high metal content and its open fracture system on the spreading Reykjanes ridge,seem to be an ideal setting for pilot plant studies on high pressure-temperature to harness similar fluidsas thrive within the black smokers on ocean ridges. Nevertheless, in selecting a suitable drillsite forresearch on supercritical fluids in Iceland, several options will and need to be discussed by researchgroups. As yet, the advisory structure for this project has not been established. Tentatively, a drillsite hasbeen selected in a saline hydrothermal system at the tip of the Reykjanes peninsula, the landwardextension of the mid-Atlantic ridge (Figure 1). The site selection is made in order to mimic conditionsof the ocean floor "black smokers" which are natural geothermal systems at supercritical conditionsThe selected drillsites at Reykjanes flank the surface geothermal manifestations, but are located withinthe high-temperature system at depth. Supercritical condition may be expected there at drillsites locatedbetween a 2000 years old volcanic fissure and a volcanic fissure from historic times (1226 AD). Whileuncertainty exists on the supercritical conditions at Reykjanes above 4 km depth, a supporting analogueis sought for the time-temperature constraint of a 2000 years old volcanic fissure at Nesjavellir, where asupercritical hydrous fluid was met at 2265 m depth in well NJ-11.The Reykjanes high-temperature area is one of many in Iceland, all of which are within the active volcanicbelt. Underground temperatures arw hundred metres. To date, 10 wellshave been drilled in the Reykjanes area. Well RN-10 is the deepest drillhole, reaching 2046 m. Itpenetrates a several hundred meter thick succession of shallow-marine sediments, submarine tuffs andpillow lava formations int

4 erbedded with subaerial lava formations
erbedded with subaerial lava formations in the upper 1 km, and a hyaloclastiteformation in between thick lava sequences in the lower 2 km. A total circulation loss of �60 l/s in wellRN-10 was met at 1900-2000 m depth in a wollastonite bearing vein system. The formation temperature,judging from the secondary alteration and temperature logs, is well over 300°C.Studies of explosion seismology show a low-velocity layer (P-velocity about 3.0 km/s) reaching a depthof 900 m. This low-velocity layer is found everywhere at the surface in the active volcanic belt(Pálmason, 1971) and is considered to correspond to porous and rather fresh volcanic breccias, pillowlavas, and individual lavas flows with a low degree of compaction (density 2.1-2.5 g/cm). This has beenverified by exploratory drilling. Cores of intensely altered hyaloclastite from 300 and 570 m depths hada porosity of 32% and 23%, respectively. Below the surface layer to a depth of 2600 m the P-velocity is 4.2 km/s, which is similar to that of Tertiaryflood basalts in Iceland. The average density of this layer is 2.6 g/cm. An exploratory drillhole reaching1750 m depth indicates that this formation is built up mainly of basaltic flows with thick interbeds ofhyaloclastites. A core of hyaloclastite at 1370 m had a porosity of 19%. No cores were obtained fromthe basalt lavas, but in that type of formation an average porosity of 3-5% can be expected. The third seismic layer under the Reykjanes Peninsula has a P-velocity of 6.5 km/s and an average 108Huang HefuReport 7 FIGURE 2: Seismic layers in the Reykjanesthermal area (Björnsson et al., 1972)density of 2.9 g/cm. It is underlain at 8.5 kmdepth by layer 4 which has a P-velocity of 7.2km/s and an average density of 3.1 g/cm(Pálmason 1971). Layer 3 is considered tocorrespond to the “oceanic layer” generally foundon the floor of the oceans, and layer 4 to theanomalous upper mantle as observed under thecritical zone of the mid-ocean ridges (Figure 2).Temperature gradients in shallow drillhole insouthwest Iceland suggest that the upper boundaryof layer 3 in this region may have a temperature of350-400°C (Pálmason, 1971). This would implythat, under the Reykjanes thermal area, the 350°Cisotherm is to be found at about 2600 m depth.The nature of the 2-3 layer boundary is notknown, but the combined seismic and temperaturedata suggest that it is a boundary betweenmetamorphic facies of basaltic rocks, perhaps agreenschist-amphibolite boundary. The densityand high degree of alteration expected in lay

5 er 3suggest a low permeability in this l
er 3suggest a low permeability in this layer, andwhether groundwater can circulate below theboundary between layers 2 and 3 is questionable,despite the low viscosity of water which would be close to critical temperature and pressure (Björnsson,Basically, the temperatures and pressures in high-temperature geothermal wells in Iceland can be expectedto follow the boiling point with depth curve (BPD) based on the assumption of water at boiling conditionsat any depth, as is the case at Reykjanes. The highest steam/water temperature which can occur at anychosen depth in a well drilled into such conditions is limited by the governing pressure. For a 4000-5000m deep exploration well, the bottom hole temperature may exceed 500°C. In such a situation, the bottomhole fluids will be at supercritical conditions. In other places the temperature and pressure may not followSupercritical conditions are expected in geothermal systems that penetrate deep into the crust where thestatic pressure exceeds the critical pressure, and where young igneous intrusions can generate supercriticaltemperatures. On land, these conditions could be found below 3.5 km depth in the crust, assuming boilingconditions in the hydrostatic fluid above. On the sea floor, the hydrostatic head of the ocean may exceedthe critical pressure and supercritical temperatures can, therefore, exist at shallow depth beneath the seafloor. However, if there is a vadose zone, or a steam deposit above the hydrothermal zone, then thepressure at the bottom of this sub-hydrostatic zone will be much lower. Therefore, in the permeable,hydrostatic regime, the curve will start there and the supercritical zone will be much deeper than the usualcurve indicates. The presence of dissolved salts in geothermal fluids has an important effect on phase 109Report 7Huang Hefu FIGURE 3: Pressure-density diagram for pureonal parameters arethe temperature and water saturation S, basedon tables presented by Schmidt (1979); CP:critical point, S: Volume fraction of liquid 02004006008001000Density (kg/m 550500450400350300Tempe atu e (°C) Pressure (bar)CP:P=220bar, T=374°CNo. 1, Pressure=100 bar No. 2, pressure=150 bar No. 3, Pressure=180 bar No. 4, Pressure=200 bar No. 5, Pressure=220 bar No. 6, Pressure=250 bar No. 7, Pressure=300 bar No. 8, Pressure=350 bar No. 9, Pressure=400 bar No.10, Pressure=450 bar 02004006008001000 FIGURE 4: Temperature-density diagram forcalculated with the “Steam” programtransitions. The temperature and pressure of the critical point increase with the increas

6 ed salinitydisplacing the conditions for
ed salinitydisplacing the conditions for supercritical fluid to greater depth. The boiling temperature of saline waterat given pressure is also higher than that of pure water. The effect delays the initiation of boiling in anThe critical point (CP) of supercritical condition for pure water is at 221.2 bar and 374.15°C. If a naturalhydrostatic hydrothermal system was at boiling point from the surface down to the critical point,maximum pressure and temperature at each depth would be determined by the boiling point depth curveabout 3.5 km depth. Below that depth the hydrousfluid would be at supercritical conditions, a hydrous gas, and there would be no phase change in the fluidupon further temperature increase at constant or rising pressure. While the hydrostatic BPD-curvecontrols the maximum pressure-temperature in most hydrothermal systems, temporal exceptions thrivewithin the systems, because the boiling water column has much lower density than a cold water column.The CP-pressure in a cold water column would, thus, be reached at about 2.3 km depth, instead of 3.5 kmin a water column at boiling point. Change in liquid density due to temperature changes. Figures 3 and 4 show the density of the water fordifferent temperatures and pressures, also above the critical point. An important characteristic of the“liquid” under discussion is its density. When temperatures and pressures are below 300°C and 100 bar-a,the density of the “liquid” is not very sensitive to temperature change, but with an increase in temperatureand pressure from 310°C, 100 bar-a to near the supercritical point (374°C and 220 bar-a), the density ofthe “liquid” changes rapidly. This means that there are other “inflection points” around the area. Forexample, under 180 bar-a, temperature increases only a few degrees from 355 to 360°C. The density ofthe “liquid” decreases from 558.05 kg/m to 123.39 kg/m (Table 1). Above the supercritical point,density changes softly with a change in temperature. 110Huang HefuReport 7 FIGURE 5: Physical states in hydrothermalsystems (Stefánsson, and Björnsson, 1982)TABLE 1: Fluid density (kg/m) at different temperatures and pressures(steam tables calculated by the STEAM-program; Bjarnason, 1985)300715.38725.74731.39734.97738.4743.33751758.1764.69770.89305703.6714.99721.14725.01728.72734742.2749.7756.68763.19703.63710.37714.58718.59724.29733741748.42755.29691.54698.98703.6707.97714.14723.6732.1739.92747.1632051.93678.59686.9691.99696.79703.51713.7722.8731.14738.833547.71632.18644.9652.27658.98668.07681.3692.

7 8702.94712.1134046.58628.12636.77644.496
8702.94712.1134046.58628.12636.77644.49654.76669.4681.9692.82702.6134545.55609.13619.62628.69640.47656.8670.5682.29692.7735044.687.24586.7600.1611.16624.98643.5658.6671.36682.5835543.7283.05577.05591.27608.01629.3646.1660.02672.136042.9179.6547.38567.58588.9614.1633648.31661.3836542.1576.69113.1537.39566.73597.4619636.01650.2537041.4374.18106.05144.76491.97539.91578.9603.9623638.637540.7671.97100.56130.47504.46558587.7609.23626.4138040.1270.0296.11121.27163.65446.37533.7570594.61613.6540037.8763.8583.94100.53121.2166.28353.3473.8523.8555.1542535.5558.3574.787.17101.3126.81188.3292.4392.41456.6245033.6254.268.3378.789.99109.04148.5201.8272.12343.2447531.9750.8663.4872.5382.1797.89128.3165.3210.3262.8950030.5348.0959.5867.776.2389.86115.2144.4178.08216.2252529.2445.7256.3363.7571.4783.65105.7130.3157.66187.9155028.0943.6553.5660.4367.5278.6198.37119.9143.24168.51Physical states in hydrothermal systems. Fordiscussion, we divide the geothermal system intoa.Vapour saturation region (1), where thedensity is less than the density of saturatedsteam () and the pressure is equal to or lessb.Boiling region (2), where two phases arepresent. The region is enveloped by theClapeyron curves for saturated vapour (and saturated liquid () at subcriticaltemperatures and pressures;c.Liquid saturated region (3), where thetemperature is less than the criticaltemperature () and the density is greaterthan the density of saturated liquid ( ) for and greater thand.Supercritical region (4), where bothtemperature and pressure exceed the criticalOf the four regions, the most important region for discussion of a geothermal system is the two-phaseboiling region enveloped by the Clapeyron curves at sub-critical temperatures and pressures (region 2).To uniquely define physical conditions within this region an additional parameter such as water saturation 111Report 7Huang Hefu FIGURE 6: WD-1A dynamic borehole temperature data. MTI, MTO: Drilling fluid temperature measured at suction line and flow line. Thermometer temperature was measured with thermometersinsider BHA about 15 m above the bit, recorded less than 1.5 hours after circulation ceased.MWD temperature: bottom hole circulation temperature measured with MWD tools; black squareshows temperature measured by melting temperature of thermal indication material; ST: recoverytime since circulation stopped. Temperature platinum resistance thermometers; temperature logs 5, 6 and 8 were recorded witha Kuster temperature instrument (Saito and Sakuma, 1997), i.e. the volume fraction of water in the

8 fluid, is needed. In the three single-p
fluid, is needed. In the three single-phase regions, the verticalpressure gradient dp/dz = is proportional to the density of the fluid. In the two-phase region, thedensity is a weighted average of both phases, assuming that both are present in a homogenous mixture.Whether this is valid for any geothermal system itions is not obvious. Onewould observe a vertical pressure gradient intermediate between that for static saturated steam and water,respectively. The intermediate gradient would enhance a counter-current flow of steam and water and aidgravity segregation of the phases. As mentioned above, Martin et al. (1976) found that a given rate of heatflow of two stable conditions of counter-current two-phase flow was theoretically possible, one with highwater saturation and liquid dominating the pressure gradient, the other with low water saturation andvapour dominating (StefánLittle published information is available describing supercritical drilling operations. Actually, it is notknown how high the pressures and temperatures of the formations may go. When drilling into thesupercritical zone, the following cases may occur. Assume that below the critical point, there is no reservoir to 5000 m, just hot dry rock (HDR).This is a case like that found in well WD-1A drilled in Kakkonda geothermal field in Japan. The well wasdrilled to 3729 m total depth. According to the borehole temperature data, the formation temperature,without the cooling effects of the drilling operation, could be delineated as follows: 200°C at 300 m depth;300°C at 1500 m; 400°C at 3200 m; and over 500°C after 159 hours recovery time below 3500 m (Saitoand Sakuma, 1997). The bottom hole pressures follow the water column pressure. In such a case, thereis not very much impact on drilling and completion of the well (Figure 6). (Temperature) 0100200300400500Pressure (bar) 50004000300020001000Depth (m) 0100200300400500 e (°C) BPD Temperature (Pressure) Water column BPD PressureAveriageDensity=0.50g/cm AverageDensity=0.10g/cm FIGURE 7: Estimated bottom hole pressuresCase B: Assume there is a reservoir somewherebelow the critical point. Actually we do not knowhow high the pressures and temperatures may goin such a reservoir. According to the BPD curve,at Critical Point (about 3500 m depth), theequivalence density of the “liquid” is about 0.65. Actually, the “liquid” density is about 0.50 at that depth, and when temperatureincreases a few degrees, the density decreasesvery rapidly. For this study, it is assumed that themaximum density of t

9 he “liquid” at supercriticalconditions i
he “liquid” at supercriticalconditions is 0.50 g/cm. With an increase of theformation temperature, the density of the “liquid”will decrease. It is assumed that the minimumdensity of the “supercritical liquid” is 0.10 g/cmEstimation of the maximum pressures and theminimum pressures of the reservoir in thesupercritical zone can thus be made (Figure 7). Inthe latter case, there will be some problems fordrilling. Should there be a big loss of circulationin the reservoir, the water level could drop downto about 2600 m depth! When drilling into these conditions, if we do not have enough water to fill thewell, the well would be heated up very quickly due to inflow of water, that could lead to an undergroundCase C: Assume the reservoir to be fracture-dominated, intersecting a fracture network connected to thedeeper supercritical zone. One example of this is the well drilled on the Big Island of Hawaii, the firstdeep geothermal well drilled on Hawaii. The well was drilled some time ago, and it was reported toproduce steam/fluids at the surface at 374°C. It was not thought to be deep enough to produce from thesupercritical zone. However, it was producing steam/fluids from fractures in volcanic rocks, and it seemspossible that this fracture network could have intersected a deeper zone that was at supercriticalAnother example is well NJ-11 drilled in 1985 in the Nesjavellir high-temperature geothermal field inIceland. The well was drilled to 2265 m total depth, a 13" anchor casing was cemented down to 183m and a 9" casing to 556 m depth. A total circulation loss occurred at 115 m depth. This warm groundwater aquifer has a static water table at 70 m depth and is sealed behind the anchor casing. Two feedzones connected to the shallow geothermal aquifer were intersected at 414 and 518 m depth. The feedzones were over-pressurized compared to the cold circulating water column. There was about 5-6 bar-goverpressure at the wellhead when circulation was stopped, and during drilling a circulation gain of some35 l/s was measured. The estimated temperatures of the two feed zones were 220 and 245°C, respectively.The production part of the well was drilled with an 8½ bit. Feed zones connected to shallow aquiferswere intersected in the depth interval 600-900 m. A wellhead pressure of 2.5 bar-g was measured andwhen circulation was stopped the immediate flow from the well was 6 l/s. Circulation loss was measuredwhen the well was about 1130 m deep, and at 1226 m �total loss occurred (40 l/s). Drilling continued to2265 m

10 total depth with a variable loss of 10-4
total depth with a variable loss of 10-40 l/s. A temperature survey was run in the well during oneof the circulation stops, see Figure 8. The upper part of the temperature logs was measured with a thermo-electric tool while 44 l/s of cold water were being pumped down the annulus at 6.8 bar-g wellheadpressure. Due to high temperatures the logging was stopped just above 1200 m depth and the deeper partsof the well had to be logged with a mechanical Amerada gauge. Temperature readings were taken at fourlevels in the well. At 1300 and 1600 m depth the measured temperature was 324 and 333°C, respectively,but at 1900 and 2000 m depth the gauge showed full deflection, indicating the temperatures at these depthsexceeded 381°C, the full deflection temperature limit of the tool used. The temperature log in Figure 8shows counter-flow in the well. The water injected at the wellhead flows down the well, some of it 113Report 7Huang Hefu 0100200300400Temperature (°C) 2500200015001000Depth (m) Boiling point depth curveMeasured 1985-05-07during drilling, cold waterinjection 44-59 l/sFIGURE 8: Temperature profile of well NJ-11for pure water is shown for comparison(Steingrímsson et al., 1990) water as a function of temperature along isobarsranging from 200 to 1000 bar. The shaded areashows a region of retrograde solubility in whichthe solubility of quartz decreases with increasingtemperature at constant pressure (Fournier, 1985)probably lost into the feed zones at 650-900 mdepth, but most of it reaches the feed zone at 1226m where it meets an up-flow originating in thebottom region of the well. The inflowtemperature of the deep aquifer is at least 380°C,but the temperature in the up-flow drops due toadditional inflow between 1600 and 1900 m depthand boiling above 1600 m. This was a typicalcase of an underground blowout. The well wasnot drilled deep enough to reach the supercriticalzone, but the temperature was higher than thesupercritical temperature. It seems possible thatthe well intersected a fracture connected to thedeeper supercritical zone. When drilling into sucha zone, the energic nature of such fluids could bemoderated because there was a pressure dropbetween the deeper fluids and the surface. Thiscase is a very dangerous case because it may lead A self-sealed zone below the criticalpoint. Given that magmatic fluid tends toaccumulate in plastic rock at lithostatic pressure,and that fluids at hydrostatic pressure circulatethrough brittle rock where permeability ismaintained by recurrent seismic activity, thenat

11 ure of the interface between these two d
ure of the interface between these two differenthydrologic regimes is of considerable theoreticalinterest and practical importance in thedevelopment of models for ore deposition. In thebrittle regime, when dilute solutions in contactwith quartz at hydrostatic pressure are slowlyheated up at pressures ranging from about 34 to900 bar (maintaining saturation with respect to thesolubility of quartz), a point is reached at whichthere is a change from dissolution of quartz toprecipitation of quartz with further heating(retrograde solubility). Figure 9 shows thecalculated solubilities of quartz as a function oftemperature at selected isobars. It also shows theregion of retrograde solubility where precipitationWhere the circulation of a relatively dilute fluid athydrostatic pressure extends downward to near thetop of a cooling pluton, at a depth of about 3-4 km(300-400 bars, Figure 9), the onset of quartzdeposition with heating would occur at about 370-390°C. Increasing salinity and pressure (at greaterdepths of circulation) move the point of maximumquartz solubility� to 400°C (Figure 10).�However, at 400°C quartz diorite starts tobecome quasiplastic and this limits the time thatfractures are likely to remain open for fluid flow. 114Huang HefuReport 7 FIGURE 10: Comparsion of calculated solubilities of quartz in water and in NaCl solutions at;Coming at the brittle-plastic transition zone from the other direction (fluid moving from the higher region in plastic rock into the lower region in brittle rock), there is a large potential for the precipitationof silica from dilute and highly� saline fluids with decreasing pressure at 400°C (Figure 10).Decompression is also likely to result in massive evaporative boiling of brine that causes additionalsupersaturation with respect to the solubility of quartz (Fournier, 1999).In the above discussion emphasis was placed on quartz deposition as a major factor in the formation ofa self-sealed zone because quartz veins commonly occur in hydrothermal systems. Other commonlyobserved veins minerals, including carbonates, sulfates, sulfides, oxides, and other silicates, may also playmajor roles in the development and/or reestablishment of a self-sealed zone.The temperatures and pressures in such formations are impossible to estimate because self-sealedconditions are different over time and the temperatures and pressures in which the self-sealed zone wasformed, and are also very complicated. When drilling into such conditions, the best way to estimate thetemperatu

12 re and pressure is to use measurement wh
re and pressure is to use measurement while drilling (MWD) tools to monitor the down-holeThe technical solution to overcome many of the problems posed by these cases is to case and cement theIn drilling high-temperature wells, knowledge of accurate temperatures with circulating time has a directbearing on drilling fluid rheology, its design, the determination of thermal stresses on tubular, thedetermination of casing depth and design of cementing programmes, logging tool design and loginterpretation. The drill bit and other down-hole tools also have temperature-sensitive parts andtemperature limitations (Table 2). Estimation of the well temperature profile while drilling is, therefore,important for success of the drilling project. Data from wells drilled in high-temperature fields all over the world suggest that the maximumtemperature can be expected to follow the boiling point curve (BPD), based on the assumption of waterat boiling conditions at any depth in the well (Figure11). Only a few wells drilled in the world are deep 115Report 7Huang Hefu 0100200300400 2500200015001000500Depth (m) Temperature vs. depth curvesK29 K30 K31 K32 RN-10 NJ-11 0100200300400 e (°C) FIGURE 11: Temperature profiles in high-temperature geothermal wells in Iceland,K-Krafla, RN-Reykjanes, NJ-NesjavellirTABLE 2: Maximum temperature rating of drilling tools and materials (from JAPEX)Model development. The estimation of circulationtemperatures while drilling is important for theselection of bits and down-hole tools. Manyapproaches can be used to estimate welltemperature, both numerical and analytical. Thereare several models and methods to calculate andanalyse the formation temperature while drilling,for example, the Horner-plot method (e.g.Parasnic, 1971), a curve fitting method based ona numerical model (Chiba et al., 1988) or analysisof fluid inclusion (e.g. Fujino and Yamasaki,1985). But all of these models and methods werebasically used in low-temperature petroleumwells. Because the temperature is very high andthere are usually more than two temperaturegradients in the same well, it is much morecomplicated to estimate a geothermal well 116Huang HefuReport 7 FIGURE 12: Circulation system of awell showing modelling parameters (1) 050100150200Time (days) Heat flow, q (W/m) 050100150200 T=350°CT=300°CT=280°CT=260°CT=240°CT=220°CT=200°CHeat flow from formation to the annulus:ln(4kt/)-1.154FIGURE 13: Heat flow from formation toannulus at different circulation times,by Equation 1temperature profile during drilling. For this

13 study, we choosethe STAR and GEOTEMP2 mo
study, we choosethe STAR and GEOTEMP2 models to calculate and analyse thegeothermal well temperature while being circulated.STAR method. The STAR model was developed by Mr. SverrirThórhallsson and Dr. Árni Ragnarsson of Orkustofnun in theyear 2000. The STAR name indicates the initials of theauthors. This author contributed to its development verifyingits accuracy by comparison with actual data. The circulation system that exists in a well at any given time isshown in Figure 12. The heat-transfer rate for the fluid in theannulus depends both on the formation temperature and thedrillpipe fluid temperature. The fluid is pumped into thedrillpipe to the bottom of the hole and then returns through theannulus to the surface. The entering fluid temperature at thesurface, the fluid inlet temperature,, can be either higher orlower then the formation temperature at the surface. However,the formation temperature at bottom hole is much higher thanthat of the fluid entering the well. Thus, during flow down thedrillpipe, the fluid generally gains heat from the annulus fluidwhich, in turn, is heated by the formation. A higher annulusfluid temperature means that it loses heat to the down-flowingHeat flow from the formation to the annulus. The heat flow, perunit length of well, (W/m),from the formation to the annulus is given by the following transitionequation (Themie project GE-0060/96, 1998):= Thermal conductivity of rock[W/m°C];= Initial formation temperature[°C]; = Annular water temperature [°C];= Circulation time [s];= Density of rock [kg/m= Heat capacity of rock [J/kg°C];= Radius of the well [m].In Equation 1, we set a circulation time, With longer circulation time, the heat flow from theformation to the annulus, , decreases. That meanswhen a well is being drilled continually, the valuechanges at a certain depth as the circulation timeincreases. Figure 13 shows the values as afunction of different circulation times.Heat flow from the annulus water to the drill pipe.The heat flow, per unit length of well, (W/m), from 117Report 7Huang Hefu (2) (3) (4) (5) (6) (7) annulus and inside of drill pipe [W/m°C];= Fluid temperature inside the drill pipe [°C]., depends on the heat transfer coefficients on the inside and outsideof the drill pipe as well as the thermal conductivity in the pipe wall. It can be calculated from the= Thermal resistance outside the pipe;= Thermal resistance of the pipe;= Thermal resistance inside the pipe;The thermal resistance outside the pipe; The Nusselt number, The thermal resistance

14 of the pipe, The thermal resistances ins
of the pipe, The thermal resistances inside the pipe, = Diameter of the well [m];= Outside diameter of the drill pipe [m];= Inside diameter of the drill pipe [m]; 118Huang HefuReport 7 (9) = Nusselt number;= Nusselt number (after correction);= Drill pipe thermal conductivity [W/m°C];= Thermal conductivity, water down flow [W/m°C];= Thermal conductivity, water up flow [W/m°C];= Water density, water down flow [kg/m = Water velocity [m/s]; = Dynamic viscosity of water [kg/ms];= Reynolds number;= Dynamic viscosity of water at average water temperature [kg/ms];= Dynamic viscosity of water at wall temperature [kg/ms];= Characteristic length for the flow (diameter) [m];= Depth of the well [m];= Prandtl number of water.Calculation of temperature profiles in the flow directions. Divide the well depth into many elements ofequal length, 500 in this case, thus assuming that the changes of the temperature in the flow direction arevery small within each element. In the beginning, we guess some value for the bottom hole temperature.By approximating the average fluid temperature in the lowermost element as equal to the bottom holetemperature, we can use the equations developed above to calculate the heat flow values for this element,, from the formation to the annulus and from the annulus to the drill pipe. A heat balance for each ofthe two flows, in the annulus and inside the drill pipe, is then used to calculate the temperature variations= Flow rate up the annulus [l/s];= Flow rate inside the drill pipe [l/s];= Specific heat of water [J/kg°C].When the new temperature at the top of the lowermost elementt(n+1), has been calculated, wemove to the next element and repeat the procedures discussed above. When the top of the well is reached,the calculated inlet water temperature to the drill pipe is compared with the actual temperature, . Thedifference is used to make a new guess for the bottom hole temperature and the calculation starts from thebeginning. This iteration procedure finally results in a drill pipe temperature at the top equal to the knowninlet water temperature.The boundary conditions of the method assume the formation temperature, follows the boiling pointwith depth curve (BPD) temperature; at bottom of the hole. Other reservoir temperature profilescan also be entered in the program.An important feature of the model is that annular flow (return) can be changed to reflect fluid losses atGEOTEMP2 program. GEOTEMP2 is a computer program, originally developed by Mondy and Duda(1984) to take i

15 nto account lost circulation and convect
nto account lost circulation and convective flow within the formation. There are sixoptions in the programme: injection, production, drilling, air drilling, mist drilling and steam production.Here we only use the drilling option to calculate and estimate the formation temperature. 119Report 7Huang Hefu 305070Temperature (°C) 2400200016001200Depth (m) MWD Temperature Temperature in Temperature out Calculated Tout (°C) Calculated Bottom Temp(°C) FIGURE 14: Well KJ-30 measured andcalculated temperature curves(by the STAR program) 04080120160200Temperature (°C) 200018001600140012001000Depth (m) Temperature in the well (measured, °C) (1) Temperature out of the well (°C)(2) MWD Temperature (measured, °C) (3) Temperature out of the well (calculated, °C) (4) Bottomhole temperature(calculated, °C) (5) Bottomhole temp (calculated by GEOTEMP2)(7) Bottomhole temp (calculated, no loss)(6) Line 6, keep the inlet temperature constant to 20°C, 40 l/s flow rate, no circulation loss.Line 7,calculated bottomhole formation temperature(0.03m) from the well,keep the inlet temperatureconstant to 20°C, flow rate40l/s, no circulation loss.FIGURE 15: Well KJ-29 measured andcalculated temperature curves by STAR andIn order to examine the precision of the estimated circulation temperatures by STAR and GEOTEMP2,data from two geothermal wells, KJ29 and KJ30, drilled in the Krafla high-temperature geothermal fieldin Iceland were compared with the calculated temperatures. Using the field data, and inputting the inlettemperature, flow rate and circulation losses according to depth (by the STAR model), a very goodagreement with measured data was obtained (Figures 14 and 15). Giving the bottom hole formationtemperature and temperature gradients (according to the BPD temperatures curve or the temperatures froma nearby well), and the drilling data, the results from the GEOTEMP2 show (Figure 15 - curve 7) that thecalculated formation temperatures (0.03 m from the well) are higher than the actual MWD temperatureslogged near the drill bit and also higher than the temperatures of the STAR model. Probably due tocooling by 5-20 l/s circulation loss in the well while drilling, the calculated temperatures of GEOTEMP2are higher as the calculations are based on no circulation losses. The wellbore temperatures (at 0.03 mfrom the well) must also be a little bit higher than that of the annulus water.Figure 16 shows the casing profile and drilling time estimated for a 5000 m deep well. According to thewell design, it consists of three sections, 700-2300 m,

16 2300-3400 m and 3400-5000 m. In the fi
2300-3400 m and 3400-5000 m. In the first section,as many wells have been drilled to that depth, the well temperature distributions are well known duringdrilling. Thus, it is not necessary to estimate the bottom hole temperature for this section of the well. In the 2300-3400 m section (12¼ hole section), assuming that the initial formation temperatures followthe BPD curve, the inlet water temperature 20°C, flow rate 50 l/s. For this section the bottom holecirculation temperatures at different depths with 5-10 l/s circulation loss and without loss are calculatedby using both STAR and GEOTEMP2 (Figure 17). Results by the STAR model show that the maximumbottom hole temperature will be 130°C at no circulation loss. Compared to well WD-1A drilled in Japan 120Huang HefuReport 7 17-1/2hole 2305 m hole hole CASING HOLE 9-5/8 CSG 3400 m 13-3/82300 m 18-5/8700 m 8-1/2 hole 5000 m LINER 5000 m 400 m 12-1/4 hole 3405 m 2060100140180Time (day) 50004000300020001000Depth (m) 12-1/4Hole, 9-5/8casing to 3400m,100 days17-1/2 Hole,13-3/8 casingat 2300m,50 days Hole,18-5/8 casing section,15 days(Including conducter, and 26 Hole section)8-1/2Hole, 7 Liner to5000m,200 daysFIGURE 16: Estimating drilling time and casing profile 050100150200250Temperature (°C) 36003200280024002000Depth (m) 050100150200250 Line (1), Inlet temperature (°C)Line (2), Outlet temperature (°C), with a circulation loss 5 l/s at 2500m,another loss 5 l/s at 3000m.Line (3), Outlet temperature (°C), no circulation loss.Line (4), Bottom hole temperature (°C),with a circulation loss 5 l/s at 2500m,another loss 5 l/s at 3000m.Line (5), Bottom hole temperature (°C), no circulation loss.Line (6), Calculated bottom temperature(0.03m from the well) by GEOTEMP2, no circulation loss(°C) Inlet temperature keep constant to 20°C, flow rate 50 l/stemperature by STAR and GEOTEMP2models (2300-3500 m) 0100200300400500Temperature (°C) 50004500400035003000Depth (m) Line (1), Inlet temperature (°C)Line (2), Outlet temperature (°C), with a circulation loss 5 l/s at 3800m,another loss 5 l/s at 4500m.Line (3), Outlet temperature (°C), no circulation loss.Line (4), Bottom hole temperature (°C),with a circulation loss 5 l/s at 3800m,another loss 5 l/s at 4500m.Line (5), Bottom hole temperature (°C),without circulation loss.Line (6), Initial formation temperature, BPD curve to 3400m, another temperature gradient to 5000mLine (7), Bottom hole temperature (°C),calculated by GEOTEMP2,without circulation loss. 0100200300400500 Inlet temperature : 20°CFlow rate: 40 l/s temperat

17 ure by STAR and GEOTEMP2models (3500-500
ure by STAR and GEOTEMP2models (3500-5000 m)(Figure 6), the estimated result isreasonable. In such situations, thebottom hole temperature is stillacceptable for most of the downholetools. The calculated temperatures byIn the 3400-5000 m (8½ hole)section, assuming that temperaturereaches the critical point at 3500 m,the temperature gradient is assumedabout 100°C/km, so the maximumformation temperature at 5000 m willexceed 500°C. Assuming the inlettemperature is 20°C, and the flow rate40 l/s, the bottom hole circulationtemperatures are calculated by boththe STAR and the GEOTEMP2program. The calculated results(Figure 18) show that if there is nocirculation loss in this section, the bottom hole temperature will be 266°C (by STAR model). In thissituation, the temperature will limit the use or reduce the life of some downhole tools. To prevent thedownhole tools from being cooked in the well, the TDS (top drive system) is recommended for use. TheGEOTEMP2 gives a very high bottom temperature, about 350°C at 5000 m. Of course, if the well hasa circulation loss somewhere, 5-10 l/s loss for example, the bottom temperature will decrease very rapidly. 121Report 7Huang Hefu FIGURE 19: Typical cyclic thermal load historyof work-hardening material 7", 34.2kg/mK55 casing (Maruyama et al., 1990) Changes of temperature during drilling operations or production or killing the well may result in severestresses, and sometimes in failure of the casing, particularly in axial compression. In a high-temperaturegeothermal well, when the casings have been run into the well and then heated, the casing is subjected toa period of heating during the heating up phase, and a cooling period during subsequent circulation orkilling of the well. When casing is heated up or cooled down, one of two things will happen: the casingwill either expand or contract if allowed to do so. If the casing is fixed at both ends, as when the casingis cemented from bottom to surface, then compressive and tensile stresses are generated as the pipe is notfree to move. These stresses may be large enough to exceed the pipe yield strength or the coupling jointstrength, resulting in casing failure. Steam temperatures as high as 400-500°C, and pressures up to 200bars have been reported in some geothermal wells. If the temperature is high enough, the yield strengthof the casing materials will be exceeded and the casing will become plastically deformed. Therefore,during the well heating phase, the casing may fail as a result of plastic deformation and the connecti

18 onsmay fail as a result of excessive com
onsmay fail as a result of excessive compressive load. When the casing is cooled, the tensile stress generatedmay be high enough to cause tensile failure of the pipe or the connection. When the casing is cooled toits original temperature (as before heating), a permanent residual tensile stress will be left in the casing.In addition to creating the potential for tensile failure, this residual tensile stress causes the casing to bemore susceptible to biaxial collapse failure.Maruyama et al. (1990) conducted a series ofexperiments to investigate the behavior of casingpipe body and connections under stimulatedthermal recovery conditions. The study examinedthe thermal stress behaviour and leak resistance ofpipe and connections at temperatures up to 354°Cunder severe loading conditions similar to thoseencountered in thermal wells. They also studiedthe biaxial collapse resistance of the casing underthe large axial tension force that would exist afterthe cooling period in a steam-stimulation process.Figure 19 shows a typical thermal-load vs.temperature diagram for 178 mm, 34.2 kg/mGrade K55 casing undergoing cyclic steamstimulation. The figure shows load vs.temperature at a final cycling temperature of354°C after the test sample had previously beensubjected to thermal cycling at 250 and 300°C(Maruyama et al., 1990). Path ABshows that the elastic response of thematerial in which compressive load is developedin proportion to the temperature change. Thecompressive load may be calculated by Equation 122Huang HefuReport 7 FIGURE 20: Effect of temperature onthe cyclic thermal load history of work-hardening material 7", 34.2kg/m K55casing (Maruyama et al., 1990)= Temperature-generated load in pipe [kN];= Young’s elastic modulus, = Temperature change [°C]; = Pipe cross-sectional area [mm].From the thermal load response presented in Figure 19, it is apparent that the amount of residual tensileload (Point F) depends strongly on the degree of plastic yielding (path BC) and the amount of stressrelaxation (path CD). A larger temperature range over which plastic yielding occurs results in a largeramount of residual tensile load. Also, a larger amount of stress relaxation results in a greater residual3.4.2 Effect of temperature, heating cycle, and casing grade on thermal load behaviour Figure 20 shows thermal load vs. temperature for 178mm, 34.2 kg/m Grade K55 casing at threetemperatures. Three new findings, however, resultedfrom the temperature and heating cycles. First, themaximum tensile and compressive loads at 3

19 00 and354°C were essentially the same, e
00 and354°C were essentially the same, even though plasticdeformation at 354°C was larger than that at 300°C.This suggests that if a significant plastic deformationexisted, the maximum compressive and tensile loadwould be the same, regardless of the temperaturedifference. Second, the amount of strincreased with temperature. It ranged from 200 kN at250°C to 400 kN at 354°C. Third, the elastic limitsin compression at 300 and 354°C were about 300 kNlarger than those at 250°C. Thus, the prestrainbuildup in the casing in the first heating cycleincreased the elastic limit of the casing duringsubsequent heating cycles because of strain aging.Hence, Grade K55 casing will actually becomestronger in the second and subsequent heating cyclesin a cyclic steam-stimulation operation. In fact, afterundergoing both work hardening and strain aging,Grade K55 casing will acquire a compressive yieldTable 3 summarizes the residual tensile stressesobtained from the thermal simulation tests for GradesK55, L80, and C95 casing (Maruyama et al., 1990).Casing gradeTemperature (°C)250300354K55270330330L80190350500C9588275549 123Report 7Huang Hefu (12) (13) 38,7 kg/m N80 casing (Maruyama et al., 1990) 38,7 kg/m K55 casing (Maruyama et al., 1990)Quenched-and-tempered casing and as-rolled casing showed significantly different collapse-resistancecharacteristics under tensile load. Figure 21 shows themeasured collapse pressure of Grade N80 casing,which is a quenched-and-tempered material. The solid line is the collapse resistance predicted byEquation 12, a modified version of the API collapse equation based on the von Mises yield criterion:= Biaxial collapse pressure [MPa];Pipe internal yield pressure [MPa]; = Pipe OD [mm]; = Pipe wall thickness [mm];= Pipe yield strength [MPa];pipe [MPa].Note that the measured collapse pressures (Figure 21) are in good agreement with those predicted byEquation 12. Figure 22 shows the measured collapse pressure for the Grade K55 casing, as-rolledmaterial. The solid line is the collapse pressure predicted by Equation 12. Note that at low axial stresses,the measured collapse pressures are in good agreement with those predicted by the API equation. At highaxial stresses, however, the measured collapse pressures are significantly higher than those predicted byWe may conclude that the biaxial collapse pressuredepends on stress/strain characteristics of thematerial. For the quenched-and-tempered material,a perfect elastic/plastic material, the biaxial collapse pressure is predicted adequately by the API eq

20 uation.Because Grades L80, C95, and P110
uation.Because Grades L80, C95, and P110 casings are all quenched-and-tempered material, we expect that their 124Huang HefuReport 7 biaxial collapse resistance can be predicted by the API equation. For the as-rolled material, a work-hardening material, the biaxial collapse resistance is much higher than that predicted by the API equation.It seems reasonable to take advantage of the work-hardening characteristic of the as-rolled material indesigning thermal wells.Tensile properties. Casings used in geothermal wells are manufactured in accordance with APIspecifications. These specifications furnish no minimum strength requirements at elevated temperatures,but list tensile properties at room temperatures for the various API grades of casing, as listed in Table 4TABLE 4: Tensile requirements of casing pipe manufacturedmax.H-4028.1-42.229.5J-5538.756.252.724.0K-5538.756.266.819.5C-7552.763.366.819.5N-8056.277.370.318.5P-11077.398.487.915.5Elongation - all groups.The minimum elongation in 2 inches shall be determined by the followingformula (API specification 5CT, 1992): = Minimum elongation in 2 inches in percent rounded to nearest ½ percent;= Cross-sectional area of the tensile test specimen in square inches, based on specifiedoutside diameter or nominal specimen width and specified wall thickness, rounded to thenearest 0.001 sq. in., or 0.75 sq. in., whichever is smaller;= Specified tensile strength [bar].For high-temperature geothermal wells, the maximum temperature in the well could reduce the strengthand other properties of steel casing materials. The design of a high-temperatures well should be based onthe reduced values. The data furnished by the casing manufacturers for room temperature are notapplicable to the high-temperature geothermal wells.Figure 23 shows the design yield strength reduction due to increased material temperature (Snyder, 1979).The modulus of elasticity also decreases from about 30×10 psi at 25C to 27×10 psi at 371C and seemsto vary little for various steels (Nicholson, 1984).Thomas (1967) reports on tests made at elevated temperatures on various grades of API casing from fourdifferent manufactures. The results of these tests are shown in Figure 24, showing the relative change inyield and tensile strength of the pipe at different temperatures. The relative change of tensile strengthturns out to be fairly consistent for all grades of 125Report 7Huang Hefu FIGURE 23: Yield strength ratio curves for indicated steel casing materialsat elevated temperatures (Nicholson, 1984) FIGURE 2

21 4: Variation in relative strength limi
4: Variation in relative strength limits(tensile or yield) for API casing. The shaded areadenotes the range of yield strength obtained for Based on this information it seems safe to assumethat the tensile strength of casing is unchanged upto a temperature of about 350C. This is inaccordance with tensile strength values atelevated temperatures for seamless pipe ofvarious grades of ASTM steels (The AmericanFor safe design the reduction in relative yieldstrength of casing is assumed to be the maximumreduction as listed by the DIN code for St.45.8.The same relative reduction is assumed to applyto all grades of casing giving the followingrelationship between yield strength andtemperature.= Minimum yield strength in room temperature condition as give in Table 4.The tensile strength of API casing is assumed to stay unchanged up to a temperature of 350C. This isin accordance with listed values for seamless pipe material made by U.S. Standards. When temperatureis high, up to 350C, and with increasing temperature, the tensile strength decreases. This assumption isalso supported by test data described in Thomas (1967) and Karlsson (1978).For a high-temperature well, the design stress intensity is defined as the lowest of the following stressa.One third of minimum tensile strength at room temperature;b.One third of minimum tensile strength at working temperature;c.Two third of minimum yield strength at room temperature;d.Two third of minimum yield strength at working temperature. 126Huang HefuReport 7 With the tensile properties of API casing listed in Table 4, and reduction in yield strength at elevatedtemperature as given by Equation 15, the design stress intensity for various grades of casing are listed inTABLE 5: Design stress intensity, kg/mmat elevated temperatures (Karlsson, 1978)/C)H-40J-55C-75N-80P-1104014.117.622.323.429.320014.117.622.323.429.322014.117.622.323.429.324014.117.622.323.429.326013.517.622.323.429.328012.917.622.323.429.330012.316.922.323.429.332011.716.122.323.429.334011.115.320.922.229.3In general, the casing programme of high-temperature geothermal wells in Iceland has, in the past, beenapproximately as listed in Table 6. Large diameter casing programmes with a 13are also common.TABLE 6: Casing programme for high-temperature geothermal wells in IcelandCasing stringDepth rangeSurface30-702218Intermediate150-40017½13Production700-100012¼9Perf. liner1500-25008½7Basically, the casing depth design, the minimum depth to which each casing string is set, is determinedby the maximum pressure to b

22 e expected in the well. But there are m
e expected in the well. But there are many other aspects and particular1.The depth of the open hole should be limited to avoid the exposure of the well to conditions whichcould be expected to lead to blowouts, not only at the surface but also underground;2.Rock type or formation, including the location of any specific stratigraphic marker beds;3.Compressive strength of rock, or at least its degree of consolidation;4.Faulting, fracturing and gross permeability;5.Different pressure system and its depth;6.Any effects on drilling activities on the formation;7.Fields types (steam-dominated, two-phase, water-dominated);8.MWD log or LWD log data which can provide instant information about the well and the formation 127Report 7Huang Hefu TABLE 7: Suggested casing programme for a deep high-temperature geothermal wellSurface703026Intermediate4002422Intermediate7002118Intermediate2300-250017½13Production3400-345012¼9Perf. Liner4000-50008½7For the IDDP deep geothermal well, the suggested casing depth design is shown in Table 7. Here the 22"casing is to be set at 400 m. The purpose is to case off the upper loss of the circulation zone. In thissection, the water temperature exceeds 100C. That can lead to blowouts. In an active reservoir at 500-600 m depth, some 5-10 bar over pressure was reported in some wells. For the safety drilling, the 18casing must be run and this section cemented. Experience suggests that the reservoir at Reykjanes isintersected down to 1900-2200 m depth, where the water temperature exceeds 300C. Many losscirculations, zones will be encountered during drilling. Running and cementing the casing successfullywill improve the opportunity for the next section to be drilled. Before drilling into supercritical condition,” casing, must be run and all the weak zones cemented off. According to theBPD temperature and pressure, the supercritical zone will be encountered below 3500 m, so theproduction casing must be set to 3400-3450 m, 100 m above the supercritical zone. Good cement is alsorequired. Supercritical fluid higher than 220 bar, and temperature higher than 370C will be encountered.The powerful fluid can lead to dangerous blowouts if we fail to run the casing and cement the casingsoundly.Loads on a well casing may be of various types and occur during the running of the casing, cementing,and drilling. The subsequent string loads on the casing occur after completion of the well. These loadsmay occur both in the axial direction of the casing (tension and compression) or in the radial direction,A

23 xial loading before and during cementing
xial loading before and during cementing. Until the annular cement sets around the casing, the tensileforce at any depth should include the weight in the air of the string below, minus the buoyant effect of anyfluid which may collect in the well. It is given by (New Zealand Standard, 1991):= Tensile force at surface from casing weight, [kN]; = Length of liner or depth of casing below any level, [m]; = Nominal unit weight of casing, [kg/m]; = Depth below liquid level, [m];= Cross-sectional area of pipe (mm), allowing for any slotting;= Mean specific volume of hot fluid, [l/kg]; = Acceleration due to gravity, [9.81 m/sThe design tensile force shall allow for dynamic loads imposed during the casing runs. Those loads mayresult from acceleration as the casing string is raised from rest to hosting speed, or deceleration due to 128Huang HefuReport 7 (17) (18) (19) (20) braking. Because very severe shock loading can be generated when the string is stopped suddenly, suchas by lowering the string quickly to the slips, this practice is forbidden, and does not need to be consideredWhen running casing, the drag force of the casing against the side of the well, particularly in directionalwells or in crooked holes, is an alternative to the acceleration loads described above. The casing shouldbe designed to withstand axial dynamic forces which should be limited by specifying the maximum hookload which may be applied.In a crooked hole, the maximum bending stress induced is (New Zealand standard, 1991): = Maximum stress due to bending, [Mpa]; = Modulus of elasticity, [Mpa]; = Outsider diameter of pipe, [mm];= Curvature [degree / 30 m].The design tensile should also include any pretensioning of the upper section of the casing after anchoringthe shoe, in order to reduce later compressive stresses due to heating. The above axial loading applied before cementing should be added together where they can applysimultaneously. The safety factor is given by The axial force imposed on casing after cementing should be checked by the = Compressive force due to heating, [kN]; = Neutral temperature, [C]; = Maximum expected temperature, [C]; = Resultant force, (kN].The corresponding safety factor is:where the minimum strength refers to the lesser one of the pipe body or joint, respectively. The safetyOf the various possible load combinations acting on the casing string, the most critical seem to be causedby external pressure and thermal expansion and by cementing with the inner-string method (collapse). 129Report 7Huang Hefu

24 It is assumed that temperature and pres
It is assumed that temperature and pressure in the well corresponds to boiling conditions. According tothe ASME Code, the internal pressure and thermal expansion results in both primary and secondarystresses. Since a given pressure is always accompanied by a given temperature, the maximum pressurethat a pipe of a given thickness can withstand may as well be given by the corresponding temperature.TABLE 8: Maximum allowable temperature for API casingH-40J-55C-75N-80P-11032.327536.028430340.031332633143.5333338�34047.0339340�34053.5340�340�34048.026454.528861.029868.030632272.0327331�340If the temperature through the pipe wall is assumed to be constant and expansion of the pipe in the axialdirection is prevented altogether, the maximum allowable temperature as prescribed by the Code is givenby Table 9 for the various API casing grades. It has been assumed that the temperature can fluctuate fromC up to a maximum. If the formcasing in the well allows an axial expansion,the resulting maximum temperatures are considerably higher as shown in Table 9.TABLE 9: Maximum allowable temperature for API casingH-40J-55C-75N-80P-110None222270320340�34020%262312�340�340�340The results in Table 9 shows that even relatively limited expansion of the pipe considerably improves thecapacity of the pipe to withstand high temperatures. It must be emphasized, however, that these resultsare based on the assumption of an integral casing string. This brings our attention to the screwed casingjoints normally used for making up the string. According to the ASME Code, the range of stress intensityallowed for such joints is only one third to one half of that allowed for integral pipe. For this reason it isto be expected that cyclic thermal loads will cauThe wellhead is an important part of the well design. For this deep geothermal well, the wellhead andvalves must be capable of withstanding the powerful supercritical fluid If you calculate the energy content of one kilogram of supercritical water, it is nearly equal to onekilogram of an explosive. But the wellheads now used in Iceland are not strong enough to withstand suchpowerful energy. A new wellhead which can handle over 300 bar pressure and temperatures over 500 For casing design, the standard practice is to design the casing while ignoring the cement effects. Thisis despite industry’s acknowledgement that there is indeed a positive cement effect on the requiredstrength of casing. A competent cement sheath, filling

25 the annulus between casing and the boreh
the annulus between casing and the borehole wall,significantly increases the burst resistance of the casing. The ballooning of the casing is constrained bythe coupled formation and cement system. This constraining effect decreases the effective stress withinthe casing by transferring radial stress to the cement and formation, lowering the tangential stress withinCementing of casing is a crucial operation for any type of well. Failure of proper placement of thedesigned slurry usually results in expensive remedial work or damage of the casing during subsequentdrilling and production or even loss of the well. In high-temperature geothermal well cementing, thehigher the temperature, the more critical the problems to be overcome to achieve a successful cement job.Present geothermal cementing equipment and practices have been adapted from the petroleum industry.But geothermal well cement is much more complicated than petroleum well cement. Not only due to hightemperature, geothermal wells in general involve many weak formations (or lost circulation zones), fromwhich cement slurry may leak and cause a cementing failure. A cementing failure may occur where gapsbetween the borehole and casing are not filled with cement; subsequent heating may lead to a break in thecasing or underground blowouts. For a high temperature deep geothermal well, the deeper the well, andthe higher the temperature, the more difficult the cement job is.To prevent such failure, operators may use a lightweight cement slurry or multi-stage cement techniques.However, conventional lightweight cement slurry, (foam cement, microspheres or perlite lightweightadditives) or multi-stage cementing techniques have the following problems:•Low compressive strength;•Diminished strength at high temperature;•Complicated cementing operations.A lightweight cement slurry with high strength at high temperature can bring about the following effects:•Prevention of cement slurry leaks into fragile formations;•Prevention of a casing collapse;•Achieve cement returns;•Reduce additional work.The conventional cementing techniques can lower the cement slurry weight to 1.45g/cm, but will reducethe cement compressive strength, and the quality of the cement bond may not be very satisfactory for deepcasing cement.Mud-to-cement (MTC) is a new cementing technique developed by the petroleum industry in China. TheDian Quan Gui Drilling Company of SINOPEC, CHINA has performed hundreds of petroleum wellcementing jobs with the MTC cement technique, including directional wells and hor

26 izontal wells and oneintermediate-temper
izontal wells and oneintermediate-temperature geothermal well; the deepest well exceeds 4500 m in depth. The temperatureis as high as 154C. The advantage of the MTC cement is the excellent quality of the cementing bond(Figure 25) and low price of the cement. The weight of MTC cement slurry is adjustable (Table 10)according to requirements from 1.25g/cm to 1.90g/cm. The strength of MTC cement is much strongerthan that required by the API standard. Figure 26 shows the MTC slurry lab test strength at 24 hours,C for different MTC slurry densities. When lowering the density to 1.25 g/cm, the strength of MTCexceeds 8.3 Mpa. It is still much better than the strength of any kind of conventional light-weight cement.The execution of the cement job is quite simple. The MTC slurry can be mixed in mud tanks beforepumping into the well. Instead of cement trucks, the mud pump can also be used to implement the cement 131Report 7Huang Hefu FIGURE 25: CBL logs with MTC cementfor a petroleum well (from 2180-2230 m) 11.21.41.61.82Density (g/cm 030 ength (MPa) / 24(hou r s, 60°C) Density 1.25 g/cmStrength 8.3-12.5 MPaDensity 1.45 g/cmStrength 10.8-13.7 MPaDensity 1.70 g/cmStrength 13.6-17.9 MPaDensity 1.80 g/cmStrength 14.2-20.8 MPaDensity 1.90 g/cmStrength 18.6-24.8 MPaFIGURE 26: MTC slurry lab test strengthC) for different slurry densitiesTABLE 10: MTC slurry lab test data1.2545-8022-2885-20050-190215-7008.3-12.51.4545-9022-2868-31040-350200-50010.8-13.71.7045-10023-27110-24055-200151-40013.6-17.91.8020-12022-26100-30055-270120-30014.2-20.81.9020-12022-24150-31170-30080-26018.6-24.8Note: This test data is used for petroleum well cementFor the MTC cement, the slag is the main materialinstead of conventional cement. Slag is a by-product of the steelworks. The chemical components of slagare CaO, SiO, MnO etc. Chemical additives such as dispersants synthesis, activatingagent, fluid loss additive, retarder, antifoaming agent and mud are used in the mix. So far no high-temperature well has been cemented with the MTC technique, but experiments at high temperatures usingthe MTC technique will be completed soon. In the future, the MTC cement is likely to substitute theconventional cement mixes in geothermal wells.Top Drive Systems (TDS) is an advanced drilling system used extensively in petroleum drilling. In thegeothermal area, the JMC Geothermal Engineering Co. Ltd, a Japanese company, used this system indrilling well WD-1A. In high-temperature drilling, many downhole tools have temperature sensitive partsand temperat

27 ure limitations (Table 2). How best to
ure limitations (Table 2). How best to cool the well during trips is a subject of interest.Using conventional cooling methods to drill high-temperature wells is a time consuming job. A newmethod was adopted to protect O-ring seals of the bit and other downhole tools from damage by hightemperatures while running in the hole. The TDS cooling method is simply to lower the string at acontrolled rate into the hole and pumping drilling fluid continuously while running the bottom-hole-assembly (BHA) into the hole by using the top-drive-drilling-system (TDS). This is not possible on aconventional rotary rig when the kelly is not connected. 132Huang HefuReport 7 FIGURE 27: Borehole temperaturePT-memory tools with and withoutpumping mud while running BHAinto the hole. A: without pumpingwater (from 16.3 to 18 elapsed hours);B: pumping water with TDS (from(Saito and Sakuma, 2000) FIGURE 28: Bit performance and dull seal condition of 8½" bit used in well-21 andTDS cooling (Saito and Sakuma, 2000)To evaluate this TDS-cooling method, the New Energy andIndustrial Technology Development Organization (NEDO)performed a test. Two high-temperature geothermal wellsWell-21 and WD-1a, which were drilled without lostcirculation for the 8½" sections, were selected. The WD-1awell was drilled using the TDS-cooling method, and well-21was drilled with the conventional technique when drillinghigh-temperature formations (Figures 27 and 28). As forthe well-21 bit performance, tri-cone bit O-ring sealssurvived and average drilled hours of the three bits was 28hours. The deepest depths where O-ring seals survived was2105 m where the static formation temperature was 350Whereas, for the WD-1a well, the depth of the last bit forwhich O-ring seals still survived was 3451m; the bits weredrilled for 31 hours where the static formation temperaturewas more than 450C. The average drilling time of the 5bits without O-ring seal failures was 50 hours, where thestatic formation temperature was between 350 and 450Judging from the bit performances for the two wells, bit lifeusing TDS-cooling method would be three to six timesgreater compared to the conventional cooling method if thesame formation temperature and depths were drilled. Economic evaluation of using TDS-cooling was made basedon the field data when these two extreme high-temperaturewells were drilled. Two examples are considered thatcompare the drilling of two 1000 m sections of an 8½" hole.Example 1: Drilling 8½" section of the well from 2500 to3500 m. Example 2: Drilling 8½" section of t

28 he well from 2000 to 3000 m. The cost f
he well from 2000 to 3000 m. The cost factors, times and bit life for each example were based on actual data.Simulation results show that the TDS-cooling resulted in more economical drilling costs for both cases.The many other advantages of using TDS are described and indicate that it will be very economical to useTDS when drilling high-temperature wells (Satio and Sakuma, 2000).3.8 Down-hole problems and preventionSafe operations are of prime importance in geothermal well drilling, not only to protect the environmentbut also to insure against loss of lives and damage to property. Downhole accidents generally includeblowouts, stuck pipe, drill string failure and bit problems. Off all the downhole problems, blowouts arethe most dangerous and costly accidents and could be disastrous for a human being.Typical blowouts in geothermal wells. There are many reports about blowouts in the petroleum industrycosting millions of dollars every year. Although there are only a few cases reported in geothermal areas,it is important that all personnel dealing with it understand thoroughly what causes blowouts and how toWell KS-8 in Kilauea in Hawaii. In June 1991, a high-pressure/high-temperature well, KS-8, located inHawaii kicked and unloaded at 1059 m. That well was estimated to have a possible bottom holetemperature of 343°C and a reservoir pressure approaching 160 bars. Immediate attempts to kill the wellwere unsuccessful, and the long process of well control was started. After 3 months of restoring the rigand equipment, pumping water to cool the well, snubbing out the drill string and replacing it with 7casing, pumping mud and cement to block the cross-flow, the final kill procedure was successfullyperformed, and well KS-8 was brought Well NJ-11 in Nesjavellir, Iceland, is another case of an underground blowout. That well was drilled to2265 m depth in 1985. Unexpectedly high temperatures and high pressures were met in that well.Controlling the well after drilling was exceptionally difficult. The pressure was deemed from the well’sbehaviour to have been well over 222 bars. The bottom hole temperature was at least 380°C, but couldhave been higher. Many attempts to seal off the loss zone at 1250m were unsuccessful, finally the wellwas partly filled up with sand.The critical point of well control for the deep well. Well control equipment is the first line of protectionagainst blowouts, but experienced operators and personnel dealing with drilling operation are moreimportant. Personnel dealing with the drilling o

29 perations must be well trained and be aw
perations must be well trained and be aware of whatproblems a powerful geothermal resource can cause and what innovative procedures will be required tosafely exploit those resources. Preventing the well from kicking is the first goal. Safety meetings andinformation meetings must be conducted before spuding the well and also at each stage of the project forall personnel. A good well design and a good cement job are also needed. For a geothermal well, 4000-5000 m deep, the well control is much more important than before. Whendrilling a hole from 700 to 2300 m, several loss-of-circulation zones will probably be met and totalcirculation losses will occur at the upper reservoir at 1900-2200 m depth. In this section, there may alsobe some fractures connected to the deep supercritical zone, as was the case in well KS-8 in Hawaii andwell NJ-11 at Nesjavellir. To prevent underground blowouts, a good practice is to block all the weakzones by cementing. Soundly casing this section off is also important. Leak off testing for the newformation below the casing shoe is necessary. The next section, from 2300 m to 3400 m has the samerequirement as the section above. With increasing depth, temperature and pressure elevate and wellcontrol becomes even more important than before. Monitoring the temperatures and circulation loss every 15-20 minutes and blocking circulation loss zones immediately is required for safe drilling. After the 9production casing is run and the cement job finished, check the BOP stack and pressure test again. Casingpressure testing and leak off testing for the new formation are also required. When drilling into the sectionbelow 3500 m, supercritical fluid will probably be met. The powerful geothermal water/steam may causemany problems. Requirements for well control are the same as mentioned above, and the driller must fillthe well with water/mud and keep the over-balance of the well. Any mistake in operation will cause aGeothermal drilling is usually performed with the traditional rotary methods used in petroleum drilling,which produces a rotation of the whole drill string, from the surface to the bottom. In such a situation,all the drill string components are subject to variable stresses depending on the position occupied in thestring. The main stress on the string is due to its own weight and increases from the bottom of the holeto the surface. Bending stresses are also present in directional wells or crooked holes (Massei and Bianchi,In drilling operations, the main causes of drill string

30 failures are cyclic bending and rotating
failures are cyclic bending and rotating bendingstresses which can lead to failure of the components from fatigue in a matter of hours, especially whenthe well axis is particularly irregular, leading to increased tensile and bending stresses. The second causeis the corrosion by fluids encountered during drilling, and the third is an inadequate quality control systemwhich fails to prevent defective components with potential crack initiations from being introduced intoGeothermal drilling is, in most cases, done in dishomogeneous formations at a very low drilling rate, andin total or partial absence of circulation returns to the surface. The higher chemical aggressiveness of thefluids circulating in geothermal wells, the lower fluid level in the wells, which strongly limits the dampingeffect on vibrations, while higher well temperature, sometimes over 500°C, creates more extremecondition than during oil drilling. And deep geothermal well drilling is tough on drill string components.As a result, geothermal drilling requires drill string components which exceed the API standard. A goodquality control system for the drill string is also required. Inspections of drill string components play a fundamental role in reducing failures. Inspections of the drillstring components includes two phases, inspections and tests during manufacturing and operations. The reliability of a component is determined during the manufacturing phase. A component that has beendesigned and manufactured under quality conditions gives greater guarantees in terms of performance andservice life. The manufacturers are required to carry out non-destructive inspections on the productionline using not only the electromagnetic system, which mainly detects superficial external defects, but alsocontinuous ultrasonic inspection, which reveals defects located in the “end area”, in the metal thicknessand on the internal surface. Specifications should guarantee the purchase of a quality product, suitablefor use for geothermal fluids. The quality of the purchased components should always be kept as high aspossible, even after use in the wells. But on-site inspections, before and after the drill string componentsare run into the well, are more important than the quality guarantee of the manufacturer. Any smallmistake in handling during transportation may lead to defects in the drill string components and any smalldefects may lead to a fishing job in the well. All the drill string components need to be checked, such assize and thickness, shoulders and th

31 reads, using the electromagnetic system
reads, using the electromagnetic system to detect superficial externaldefects, and continuous ultrasonic inspection before the drill string is run into the well, using the samemethods to inspect the drill string components on every trip. Change the drill pipe position on every tripwhen the well is going deeper. Any defects made by pipe tongs or slips may also cause the failures of thepipes. Develope pipe management and a utilisation system and inspection record; form a data base toreconstruct the pipes history and conduct systematic drill string inspections depending on the workinghours of the pipes; all these are parts of a quality control system. With increasing well depth, more bit problems will occur. A TDS system is recommended to be used tocool down the bit while running into the hole, but the bottom hole temperature may still be too high andaffect the bit life. According to temperature modelling mentioned in chapter 3.3.4, the bottom holecirculation temperature is still as high as 200°C or higher at 4000 m depth. It will exceed the temperaturelimitation of the sealed bearing of the bit. The formation becomes abrasive with increasing depth, so anew kind of bit with high temperature resistance needs to be developed for the job. The PDC or TSP bitmay be a good choice for such deep well drilling.Conventional wells (less than 2500 m deep) drilled in Iceland suggest that the wellbore is very stable andfew well bore collapse problems occur while drilling. Instead of using mud, only water is used fordrilling. But with increasing well depth, well bore stability may become a problem. If there was a wellbore collapse and a stuck pipe in a deep well, a huge sum of money could be spent for the fishing job! Itmay become necessary to use mud for deep drilling if there is a wellbore collapse problem. Theconventional drill mud materials have a temperature limitation below 300°C; the maximum temperaturelimit is 350°C. So a new kind of drill mud material must be developed and a drill mud cooling systemimplemented for the high-temperature well.The foreseeable need for deep drilling for exploitable hydrothermal fluids in Iceland during the 21century calls for research on supercritical hydrous fluids. The high-temperature geothermal systemswithin the rift zones in Iceland provide several options for finding suitable targets for supercritical fluids.Tentatively, the active rift zone at Reykjanes, the landward extension of the Reykjanes Ridge, has beenWhen drilling into supercritical conditions, many problems may occur

32 due to severe conditions relatedto incr
due to severe conditions relatedto increasing well depth and rising temperatures and pressures, so a new advanced technology is needed.This study indicates that such a well can be cooled considerably while being drilled. But the casing andcement, well control, wellhead and downhole tools still need further study. The technical gain from deepdrilling and research could have a global impact on geothermal utilization and is a challenging projectworthy of international collaboration.I would like to express my heartfelt gratitude to Dr. Ingvar Birgir Fridleifsson for giving me theopportunity to attend the UNU Geothermal Programme. I would like to express my gratitude to Mr.Sverrir Thórhallsson, my advisor, for his assistance, guidance and discussions during preparation of thereport and also his generous hospitality. I am much obliged to Dr. Árni Ragnarsson, for his help andcritical advice for this report. I wish to give thanks to Mr. Ómar Sigurdsson, Dr. Gudmundur ÓmarFridleifsson and Mr. Ásgrimur Gudmundsson for their willingness to help. And thanks to all the lecturers,and staff members at Orkustofnun for their comprehensive presentations in sharing their knowledge andThanks go to Mr. Lúdvík S. Georgsson for all the care and generous help and advice during the wholetraining period. And, thanks to Mrs. Gudrún Bjarnadóttir for her wonderful care. My deep appreciationis due to my mama and my wife for their love and inspiration. API 1992: ). API, specification 5CT (SPECBjarnason, J.Ö., 1985: The computer program STEAM. Orkustofnun, Reykjavík, report OS-85069/JHD-Björnsson, S., Arnórsson, S., and Tómasson,T., 1972: Economic evaluation of Reykjanes thermal brineChiba, M., Takasugi, S., Hachino, Y., and Muramatsu, S.,1988: Estimating of equilibrium formationtemperature by curve fitting method. Fournier, R.O., 1983: Self-sealing and brecciation resulting from quartz deposition within hydrothermalsystem (abs.). Proceedings of the 4 International Symposium on Water-Rock Interaction, JapanFournier, R.O., 1985: The behaviour of silica in hydrothermal solutions. Rev. Econ. Geology, 45-61.Fournier, R.O., 1999: Hydrothermal processes related to movement of fluid from plastic into brittle rockin the magmatic-epithermal environment. Fridleifsson, G.Ó., and Albertsson A., 2000: Deep geothermal drilling on the Reykjanes ridge opportunityfor international collaboration. Proceedings of the World Geothermal Congress 2000, Kyushu-Tohoku,Fujino, T., and Yamasaki, T., 1985: The use of fluid inclusion geothermometry as

33 an indicator of reservoirtemperature an
an indicator of reservoirtemperature and thermal history in the Hatchobaru geothermal field, Japan. Geoth. Res. Council,Karlsson, Th., 1978: Casing design for high temperature geothermal wells. Geoth. Res. Council,Martin, J.C., Wegner, R.E., and Kelsey, F.J., 1976: One-dimensional convective and conditive geothermalheat flow. Proceedings of the 2 Workshop on Geothermal Reservoir Engineering, Stanford University,Maruyama, K., Tsuru, E., Ogasawara, M., Inoue, Y., and Peters, E.J., 1990: An experimental study ofcasing performance under thermal cycling conditionsMassei, S., and Bianchi, C., 1995: Failure control of drill string components: Nondestructive inspections.Mondy, L.A., and Duda, L.E., 1984: Advanced wellbore thermal simuNew Zealand Standard, 1991: Code of practice for deep geothermal wells. Standards Association of NewNicholson, R.W., 1984: Casing design for temperature regimes in geothermal wells. Geoth. Resourc.Council Bulletin, May,Pálmason, G., 1971: Soc. Sci. Isl., 40, 187 pp. Parasnic, D.S., 1971: Temperature extrapolation to infinite time in geothermal measurement. Geophys.Rickard, B., Livesay, B.J., Teplow, B., Winters, S., Evanoff, J., and Howard, W.T., 1995: Control of wellKS-8 in the Kilauea lower east rift zone. Proceeding of the World Geothermal Congress 1995, Florence,Saito, S., and Sakuma, S., 1997: Frontier geothermal drilling operations succeed at 500°C BHSTSaito, S., and Sakuma, S., 2000: Economics of increased bit life in geothermal wells by cooling with atop drive system. Proceedings of the World Geothermal Congress 2000, Kyushu-Tohoku, JapanSchmidt, E., 1979: Properties of water and steam in SI-Units revised edition ). Springer-Verlag,Snyder, R.E., 1979: Casing failure in geothermal wells. Geoth. Resourc. Council, Transactions, 3Stefánsson, V., and Björnsson, S., 1982: Physical aspects of hydrothermal systems. Continental andSteingrímsson, B., Gudmundsson, Á., Franzson, H., and Gunnlaugsson, E., 1990: Evidence of asupercritical fluid at depth in the Nesjavellir field. Proceedings of the 15 Workshop on GeothermalThe American National Standards, 1973: ANSI B-31.1, power piping and ANSI B31-1.3, petroleum American National Standards.Thermie Project GE-0060/96, 1998: Demonstration of improved energy extraction from a fracturedOrkustofnun, Reykjavík report OS-98050, 42 pp.Thomas, P.D., 1967: High temperature tensile properties of casing and tubing. Presented at the APIDivision of Production 1967 Midyear Standard). VDI - Verlag GmbH, Dusseldorf. Longman, London and