/
ALMA How does it work and how to ALMA How does it work and how to

ALMA How does it work and how to - PowerPoint Presentation

ellena-manuel
ellena-manuel . @ellena-manuel
Follow
406 views
Uploaded On 2018-03-19

ALMA How does it work and how to - PPT Presentation

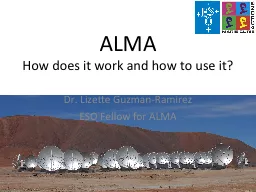
use it Dr Lizette GuzmanRamirez ESO Fellow for ALMA What is ALMA Atacama Large Millimeter and submillimeter Array ALMA as an Interferometer 66 antennas working as one radiotelescope ID: 656784

discoveries alma antennas star alma discoveries star antennas resolution shows dust bands gas antenna baseline image array observations 163

Share:

Link:

Embed:

Download Presentation from below link

Download Presentation The PPT/PDF document "ALMA How does it work and how to" is the property of its rightful owner. Permission is granted to download and print the materials on this web site for personal, non-commercial use only, and to display it on your personal computer provided you do not modify the materials and that you retain all copyright notices contained in the materials. By downloading content from our website, you accept the terms of this agreement.


Presentation Transcript

Slide1

ALMA

How does it work and how to use it?

Dr. Lizette Guzman-RamirezESO Fellow for ALMASlide2

What is ALMA?

Atacama Large Millimeter and sub-millimeter Array.Slide3
Slide4

ALMA as an Interferometer

66 antennas working as one

radiotelescope

.

Is as if we had a 15km

radiotelescope

.Slide5

ALMA as an Interferometer

ALMA is 10-100 times more sensitive and have 10-100 times better angular resolution than existing instruments.

Total cost US$ 1.3 billionsSlide6

One antenna the resolution goes λ/D, where D is the diameter of the antenna.

How interferometry works

Two antennas the resolution goes

λ

/B, where B is the baseline between the two antennas.

D

BSlide7

How interferometry worksSlide8

InterferometrySlide9

The 66 antennas and electronics working with a precision of one picosecond (10-12s).

The signals from the different antennas must be combined in a way that the path followed from each antenna until it is combined at the central computer (the correlator) must be known with an accuracy equal to the diameter of a human hair (10-9m). Seven weather stations, and specially-built Water Vapor Radiometers (WVR) to measure the amount of line-of-sight water vapor present in the atmosphere, will be used to correct for the atmospheric effects.

How interferometry worksSlide10

The antennas are moved using a transporterSlide11

Main parts of an ALMA antenna

AntennaIt captures and concentrates the radio waves coming from the astronomical source at the point known as the focus. The light is reflected by a second reflecting surface –called a subreflector- to a point behind the parabolic surface, where there is a receiver geared to capture the signal concentrated by the antenna.Slide12

54 (12m) and 12 (7m) antennas

12m Array

Baseline (BL)

7

m Array

Atacama Compact Array (ACA)Slide13

The Front End is where the signal gets amplified, it has to be cooled to 4KSlide14

The Back End to the central computer (correlator), and subsequently transmits it to the central building.Slide15

The correlator is the fastest supercomputer that take the signals from

the antennas and combine themSlide16

ALMA bandsSlide17

ALMA bands

ALMA BandFrequency (GHz)

131 - 45

2

67 - 90

3

84 - 116

4

125 - 163

5

163 - 211

6

211 - 275

7

275 -

373

8

385 - 500

9

602 - 720

10

787 - 950Slide18

ALMA bandsSlide19

Main molecules per band

ALMA BandFrequency (GHz)

Main Lines1

31 - 45

2

67 - 90

3

84 - 116

CO(1-0)

4

125 - 163

H

2

O

5

163 - 211

6

211 - 275

CO (2-1)

7

275 -

373

CO (3-2), [CII] z=58

385 - 500CO (4-3), [CII] z=3 9

602 - 720CO (6-5), [CII] z=2

10

787 - 950

CO (7-6), CO (8-7)Slide20

Splatalogue

The splatalogue catalog is maintained by NRAO and is a compilation from several databases for molecular and atomic lines. Many spectral lines are listed in it, so it is a very useful tool in planning observations for ALMA.http://www.splatalogue.netSlide21

SplatalogueSlide22

Observing modes

The telescope can be set in “frequency division mode” (FDM), which means that high spectral resolution can be reached but with bandwidth, quantization, and Nyquist sampling restrictions.In the “time division mode” (TDM), the entire 2 GHz bandwidth is used at 3 bit level quantization. This mode is used to observe continuumSlide23

Velocity resolution per band per observing modeSlide24

Spatial resolution per frequencyThis depends on the baseline, for this case 1km baseline was used for bands 3-7 and 1.5km for 8 & 9. For Cycle 3 longer baselines will be offered, up to 15km

(resolution is roughly an order of magnitude better)Slide25

For a baseline of 16km at 650GHz the resolution is 0.005” (5marcsec)Slide26

Science goalsALMA Deep Field – High-z galaxies

Star and Planet formationChemistry in molecular cloudsMap gas and dust in the Milky Way and other galaxiesEvolved starts – dust formationThe Sun – origin of solar windSlide27

ALMA discoveries

Multiwavelength composite of the Antennae, showing their namesake tidal tails in radio (blues), past and recent starbirths in optical (whites and pinks) ALMA’s first mm/submm test views, in Bands 3 (orange), 6 (amber), & 7 (yellow), showing detail surpassing all other views in these wavelengths. Slide28

ALMA discoveries

The dust ring around the bright star Fomalhaut. The underlying blue picture shows an earlier picture obtained the HST. The new ALMA image has given astronomers a major breakthrough in understanding a nearby planetary system and provided valuable clues about how such systems form and evolve.Slide29

ALMA discoveries

A spiral structure around the old star R Sculptoris. This feature has never been seen before and is probably caused by a hidden companion star orbiting the star. This slice through the new ALMA data reveals the shell around the star, which shows up as the outer circular ring, as well as a very clear spiral structure in the inner material.Slide30

ALMA discoveries

This composite shows the region around the massive star-forming region SDC 335.579-0.292. The Spitzer view is at infrared wavelengths (3.6, 4.5 and 8.0 microns) and the ALMA view is at wavelengths around three millimeters. The yellow blob at the center of the ALMA images is a stellar womb with over 500 times the mass than the Sun. The embryonic star is feeding on the material that is racing inwards. It is expected to give birth to a 100Mo star. Slide31

ALMA discoveries

Observations of CO fog by hunting for a different molecule known as diazenylium (N2H+). This fragile molecule is easily destroyed in the presence of CO gas, so would only appear in detectable amounts in regions where CO had frozen out, and is hence a proxy for CO ice.Slide32

ALMA discoveries

This image from ALMA shows the distribution of molecular gas close to the supermassive black hole at the centre of the galaxy NGC 1433. As well as discovering the spiral structure ALMA observations have also revealed an unexpected small outflow of material from the central black hole.Slide33

ALMA discoveries

ALMA data (in red) shows newly formed dust in the center of the remnant. HST (in green) and Chandra (in blue) show the expanding shockwave.Slide34

ALMA discoveries

Dust and gas disk around HD142527. The dust and gas distributions observed by ALMA are shown in red and green, respectively. Near-infrared image taken by the NAOJ Subaru Telescope is shown in blue. The image clearly shows that the dust is concentrated in the northern (upper) part of the disk.Slide35

ALMA discoveries

Detection of radio emission from GRB host galaxies, which had been a long-sought goal for astronomers, was finally made possible by ALMA with its unprecedentedly high sensitivity.Slide36

ALMA discoveries

ALMA Pinpoints Pluto to Help Guide NASA’s New Horizons Spacecraft. The cold surface of Pluto and its largest moon Charon as seen with ALMA on July 15, 2014.Slide37

ALMA discoveries

The sharpest image ever taken by ALMA. It shows the protoplanetary disc surrounding the young star HL Tauri. These new ALMA observations reveal substructures within the disc that have never been seen before and even show the possible positions of planets forming in the dark patches within the system.