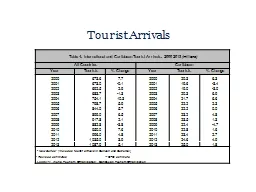
/
Tourist Arrivals Table 4: International and Caribbean Tourist Arrivals:  2000-2013 Tourist Arrivals Table 4: International and Caribbean Tourist Arrivals:  2000-2013

Tourist Arrivals Table 4: International and Caribbean Tourist Arrivals: 2000-2013 - PowerPoint Presentation

ellena-manuel
ellena-manuel . @ellena-manuel
Follow
367 views
Uploaded On 2018-11-09

Tourist Arrivals Table 4: International and Caribbean Tourist Arrivals: 2000-2013 - PPT Presentation

millions All Countries Caribbean Year Tourists Change Year Tourists Change 2000 6736 77 2000 203 63 2001 6730 01 2001 196 34 2002 6925 ID: 725566

caribbean tourist 2013 2000 tourist caribbean 2000 2013 organization 2003 tourism 2012 2011 2010 2009 2008 2006 2005 2004

Share:

Link:

Embed:

Download Presentation from below link

Download Presentation The PPT/PDF document "Tourist Arrivals Table 4: International ..." is the property of its rightful owner. Permission is granted to download and print the materials on this web site for personal, non-commercial use only, and to display it on your personal computer provided you do not modify the materials and that you retain all copyright notices contained in the materials. By downloading content from our website, you accept the terms of this agreement.


Presentation Transcript

Slide1

Tourist Arrivals

Table 4: International and Caribbean Tourist Arrivals: 2000-2013

(millions)

All Countries

Caribbean

Year

Tourists

% Change

Year

Tourists

% Change

2000

673.6

7.7

2000

20.3

6.3

2001

673.0

-0.1

2001

19.6

-3.4

2002

692.5

2.9

2002

19.0

-3.0

2003

683.7

-1.3

2003

20.3

6.9

2004

754.1

10.3

2004

21.7

6.6

2005

798.7

5.9

2005

22.2

2.3

2006

844.0

5.7

2006

22.2

0.0

2007

899.0

6.5

2007

23.2

4.8

2008

917.8

2.1

2008

23.5

1.3

2009

882.8

-3.8

2009

22.4

-4.7

2010

950.0

7.6

2010

22.8

1.6

2011

996.0

4.8

2011

23.4

2.7

2012

1,035.0

3.9

2012

24.6

4.9

2013

1,087.0

5.1

2013

25.0

1.8

n

New Series: (Includes tourist arrivals in Cancun and Cozumel)

r

Revised estimates

** CTO estimate


Sources:

World Tourism Organization; Caribbean Tourism OrganizationSlide2

Tourist Receipts

Table 4: International and Caribbean Tourist Receipts:

2000-2013

(US

$ billions)

All Countries

Caribbean*

Year

Expenditure

% Change

Year

Expenditure

% Change

2000

477.1

4.2

2000

20.0

5.8

2001

465.4

-2.5

2001

19.5

-2.6

2002

484.6

4.1

2002

18.2

-6.6

2003

532.4

9.9

2003

20.1

10.7

2004

633.2

18.9

2004

21.7

7.6

2005

678.0

7.1

2005

21.6

-0.2

2006

742.8

9.6

2006

24.2

11.7

2007

856.5

15.3

2007

26.1

8.0

2008

939.7

9.7

2008

26.9

2.8

2009

855.0

-9.0

2009

24.4

-10.2

2010

930.0

8.7

2010

25.5

4..4

2011

1,043.0

12.0

2011

26.5

3.8

2012

1,078.0

3.4

2012

27.4

3.6

2013

1,159.0

7.5

2013

28.1

2.3

n

New Series: (Includes tourist receipts from Cancun and from 1993 Cozumel)

Sources:

World Tourism Organization; Caribbean Tourism Organization