PPT-Two Mean Neuronal Waveforms
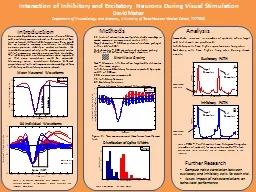
Distribution of Spike Widths Interaction of Inhibitory and Excitatory Neurons During Visual Stimulation David Maher Department of Neurobiology and Anatomy University
Download Presentation
"Two Mean Neuronal Waveforms" is the property of its rightful owner. Permission is granted to download and print materials on this website for personal, non-commercial use only, provided you retain all copyright notices. By downloading content from our website, you accept the terms of this agreement.
Presentation Transcript
Transcript not available.