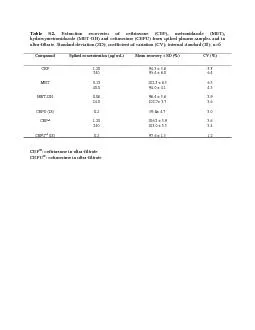
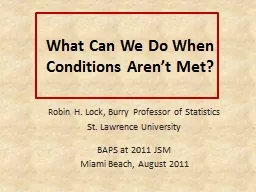
Robin H Lock Burry Professor of Statistics St Lawrence University BAPS at 2011 JSM Miami Beach August 2011 Example 1 CI for a Mean To use t the sample should be from a normal ID: 661207
Download Presentation The PPT/PDF document "What Can We Do When Conditions Aren’t ..." is the property of its rightful owner. Permission is granted to download and print the materials on this web site for personal, non-commercial use only, and to display it on your personal computer provided you do not modify the materials and that you retain all copyright notices contained in the materials. By downloading content from our website, you accept the terms of this agreement.
Slide1
What Can We Do When Conditions Aren’t Met?
Robin H. Lock, Burry Professor of StatisticsSt. Lawrence UniversityBAPS at 2011 JSMMiami Beach, August 2011Slide2
Example #1: CI for a Mean
To use
t*
the sample should be from a
normal
distribution.
But what if the sample is clearly skewed, has outliers, …?Slide3
Example #2: CI for a Standard Deviation
Example #3: CI for a Correlation
What is the distribution?
What is the distribution?Slide4
Alternate Approach:
Bootstrapping“Let your data be your guide.”
Brad
Efron
– Stanford UniversitySlide5
What
is a bootstrap? and How does it give an interval?Slide6
Example #1: Atlanta Commutes
Data: The American Housing Survey (AHS) collected data from Atlanta in 2004. What’s the mean commute time for workers in metropolitan Atlanta? Slide7
Sample of n=500 Atlanta Commutes
Where might the “true” μ be?
n
= 500
29.11 minutes
s = 20.72 minutes
Slide8
“Bootstrap” Samples
Key idea: Sample with replacement from the original sample using the same n. Assumes the “population” is many, many copies of the original sample. Slide9
Atlanta Commutes – Original SampleSlide10
Atlanta Commutes: Simulated Population
Sample from this “population”Slide11
Creating a Bootstrap Distribution
1. Compute a statistic of interest (original sample).2. Create a new sample with replacement (same n).3. Compute the same statistic for the new sample.4. Repeat 2 & 3 many times, storing the results.
Important point: The basic process is the same for ANY parameter/statistic.
Bootstrap sample
Bootstrap statistic
Bootstrap distributionSlide12
Bootstrap Distribution of 1000 Atlanta Commute Means
Mean of ’s=29.116
Std.
dev
of ’s=0.939
Slide13
Using the Bootstrap Distribution to Get a Confidence Interval – Version #1
The standard deviation of the bootstrap statistics estimates the standard error of the sample statistic.Quick interval estimate :
For the mean Atlanta commute time:
Slide14
Example #2 : Find a confidence interval for the
standard deviation
,
σ
, of prices (in $1,000’s) for Mustang(cars) for sale on an internet site. Original sample: n=25, s=11.11
Bootstrap distribution of sample std.
dev’s
SE=1.61Slide15
Using the Bootstrap Distribution to Get a Confidence Interval –
Method
#2
27.34
30.96
Keep 95% in middle
Chop 2.5% in each tail
For a 95% CI, find the 2.5%-tile and 97.5%-tile in the bootstrap distribution
95% CI=(
27.34,31.96)Slide16
90% CI for Mean Atlanta Commute
For a 90% CI, find the 5%-tile and 95%-tile in the bootstrap distribution
27.52
30.66
Keep
90%
in middle
Chop
5%
in each tail
Chop
5%
in each tail
90%
CI=(
27.52,30.66)Slide17
99% CI for Mean Atlanta Commute
For a 99% CI, find the 0.5%-tile and 99.5%-tile in the bootstrap distribution
26.74
31.48
Keep
99%
in middle
Chop
0.5%
in each tail
Chop
0.5%
in each tail
99%
CI=(
26.74,31.48)Slide18
What About Technology?
Possible options?FathomRMinitab (macro)
JMP
Web
appsOthers?
xbar=function(
x,i) mean(x[i])x=boot(Margin,xbar,1000)
x=do(1000)*
sd
(sample(Price,25,replace=TRUE))Slide19
www.lock5stat.com
(coming soon)Slide20
Example #3: Find a 95% confidence interval for the correlation between size of bill and tips at a restaurant.
Data: n=157 bills at First Crush Bistro (Potsdam, NY)
r=0.915Slide21
Bootstrap correlations
95% (percentile) interval for correlation is (0.860, 0.956)BUT, this is not symmetric…
0.055
0.041
Slide22
Method #3: Reverse Percentiles
Golden rule of bootstraps: Bootstrap statistics are to the original statistic as the original statistic is to the population parameter.
0.041
0.055Slide23
What About Hypothesis Tests? Slide24
“Randomization” Samples
Key idea: Generate samples that arebased on the original sample ANDconsistent with some null hypothesis.Slide25
Example: Mean Body Temperature
Data: A sample of n=50 body temperatures. Is the average body temperature really 98.6oF?
H
0
:
μ
=98.6
H
a
:
μ
≠98.6
n
= 50
98.26
s = 0.765
Data from Allen Shoemaker, 1996 JSE data set article Slide26
Randomization Samples
How to simulate samples of body temperatures to be consistent with H0: μ=98.6?
Add 0.34 to each temperature in the sample (to get the mean up to 98.6).
Sample (with replacement) from the new data.
Find the mean for each sample (H0 is true).
See how many of the sample means are as extreme as the observed
98.26.
Fathom DemoSlide27
Randomization Distribution
98.26
Looks pretty unusual…
p-value ≈ 1/1000 x 2 = 0.002Slide28
Choosing a Randomization Method
A=Caffeine246248
250
252
248250
246248
245250mean=248.3B=No Caffeine
242
245
244
248
247
248
242
244
246
241
mean=244.7
Example: Finger tap rates (Handbook of Small Datasets)
Method #1: Randomly scramble the A and B labels and assign to the 20 tap rates.
H
0
:
μ
A
=
μ
B
vs. H
a
:
μ
A
>
μ
B
Method #3: Pool the 20 values and select two samples of size 10 (with replacement)
Method #2: Add 1.8 to each B rate and subtract 1.8 from each A rate (to make both means equal to 246.5). Sample 10 values (with replacement) within each group. Slide29
Connecting CI’s and Tests
Randomization body temp means when μ=98.6
Bootstrap body temp means from the original sample
Fathom DemoSlide30
Fathom Demo: Test & CISlide31
Materials for Teaching Bootstrap/Randomization Methods?
www.lock5stat.com
rlock@stlawu.edu