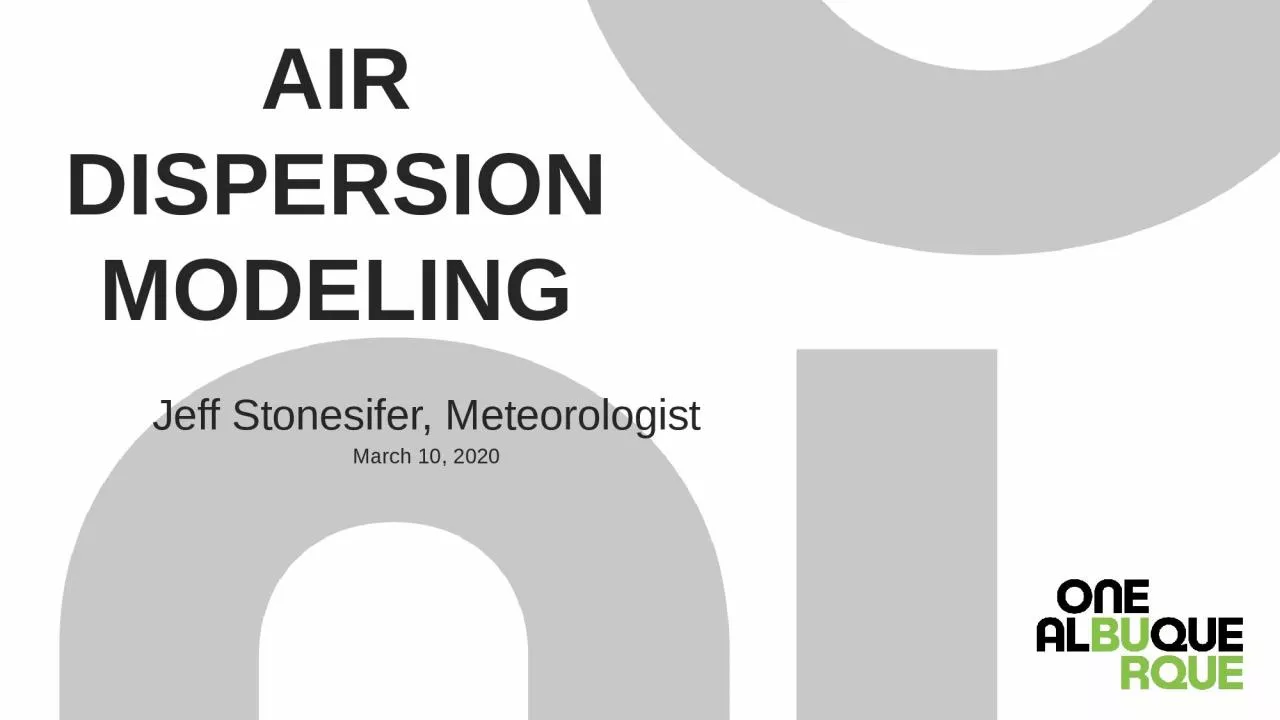
/
Air Dispersion Modeling Jeff Stonesifer, Meteorologist Air Dispersion Modeling Jeff Stonesifer, Meteorologist

Air Dispersion Modeling Jeff Stonesifer, Meteorologist - PowerPoint Presentation

fanny
fanny . @fanny
Follow
64 views
Uploaded On 2024-01-03

Air Dispersion Modeling Jeff Stonesifer, Meteorologist - PPT Presentation

March 10 2020 2 Using Air Dispersion Modeling Models estimate impacts of pollution emitted by industry Compare the estimated impacts to air quality standards Air quality standards limit emissions from industry ID: 1037414

epa air dispersion modeling air epa modeling dispersion aermod quality gov https model impacts no2 scram amp www reviews

Share:

Link:

Embed:

Download Presentation from below link

Download Presentation The PPT/PDF document "Air Dispersion Modeling Jeff Stonesifer,..." is the property of its rightful owner. Permission is granted to download and print the materials on this web site for personal, non-commercial use only, and to display it on your personal computer provided you do not modify the materials and that you retain all copyright notices contained in the materials. By downloading content from our website, you accept the terms of this agreement.


Presentation Transcript

1. Air Dispersion ModelingJeff Stonesifer, MeteorologistMarch 10, 2020

2. 2Using Air Dispersion ModelingModels estimate impacts of pollution emitted by industryCompare the estimated impacts to air quality standardsAir quality standards limit emissions from industrypurpose

3. 3Connection to PermittingModeling used to set permit conditionsRequire control strategiesHours of operationEmission ratesDistance of equipment from fencePermitting

4. 4Sprinkler system surrounded by bucketsWind is important in distributing waterDepth of water in buckets ~ concentrations at receptorsAnalogy

5. Dispersion Model InputsWIND PROFILEVORTEXBuildingCENTERLINEMeteorology Wind speed Wind direction TemperatureSources Source type ParametersEmissions Rates Hrs of operationTerrain & Land Use Rural or urban ElevationsGravitational Settling Particle Size DensityDownwash Buildings5inputs

6. 6Point SourceSource type

7. 7Volume SourceSource type

8. 8Federal, State, & Local GuidelinesFederal: 40 CFR 51, a.k.a. Appendix WNMED’s Air Dispersion Modeling GuidelinesAir Quality Program’s Air Dispersion Modeling GuidelineGuidelines

9. 9Cumulative Impacts ModelingBackground levels are from monitored dataBackground data added to modeled impactInclusion of nearby facilities depends onDistance from applicant’s facilityAmount of emissions from nearby facilitiesWhat the background monitor is samplingCumulative impacts

10. 10Recent modeling reviewAlbuquerque Asphalt HMAAlbuquerque Asphalt aggregate plantD&R TankExample

11. 11NO2 model for the same facilityexample

12. 12More on cumulative modeling“…the question of which nearby sources to include in the cumulative modeling is inextricably linked to the question of what the ambient monitoring data represents within the project area.” –Section 8.3.3(a), p. 5221Cumulative impact is compared to air quality standardsCumulative impacts

13. 13Compare to StandardsNAAQSModeled Impact (µg/m3)Background (µg/m3)Model + Background (µg/m3)Level of the standard (µg/m3)NO2 1-hour117.162.8179.9188PM10 24-hour65.735100.7150compliance

14. 14AERMODU.S. EPA’s preferred air dispersion model since Nov. 2005Standard among all regulatory clean air agenciesConfidence that AERMOD doesn’t underestimateEPA is concerned about underestimationLOWWIND options have not been accepted for regulatory modelingEPA Model

15. 15AERMOD ReliabilityEPA SCRAM websiteDatabases used to evaluate AERMOD performanceDocuments on AERMOD performance and formulationSupport Center for Regulatory Atmospheric Modeling (www.epa.gov/scram)Reliability

16. 16Example of EPA Testing AERMOD Excerpts from description of EPA experiment: “…near-surface, non-buoyant tracer release” experiments with “surface sampling arrays positioned 50 meters to 800 meters downwind…”Empire Abo, NM field study mentioned in March 1, 2011 EPA clarification memo Verification

17. 17Furthering the Margin of SafetyRural dispersion coefficientsContinuous full bore operations for all sources on propertyLack of NO2/NOX data  often results in worst-case assumptionsSafety

18. 18Reasons EHD Rejects ModelingDiscrepancy between model & applicationE.g. Application requests operations 7 days/wk; only modeled 6 days a weekInappropriate modeling techniquesOutdated downwash algorithmInappropriate use of urban dispersionIncorrect modelingSources, roads, fence don’t match up with aerial imageryRejections

19. 19Example of Incorrect Mappingexample

20. 20In ConclusionAQP uses checklists for protocol reviews, preliminary reviews, final reviews, and peer reviews as a matter of quality assurance and quality control. AERMOD- a reliable tool for keeping Bernalillo County within the standards for particulates, H2S, lead, NO2, SO2, and COconclusion

21. Questions?

22. referencesAERMOD User’s Guide, https://gaftp.epa.gov/Air/aqmg/SCRAM/models/preferred/aermod/aermod_userguide.pdfAERMOD: Latest Features and Evaluation Results, EPA-454/R-03-003, June 2003, https://gaftp.epa.gov/Air/aqmg/SCRAM/models/preferred/aermod/aermod_mep.pdfGuideline on Air Quality Models (aka Appendix W), https://www.epa.gov/sites/production/files/2020-09/documents/appw_17.pdf22

23. REFERENCESAdditional Clarification Regarding Applicability of Appendix W Modeling Guidance for the 1-hour NO2 NAAQS (EPA Clarification Memo, 01Mar2011), https://www.epa.gov/sites/production/files/2020-10/documents/additional_clarifications_appendixw_hourly-no2-naaqs_final_03-01-2011.pdf23

24. REFERENCESCity of Albuquerque Environmental Health Department Air Dispersion Modeling Guidelines, https://documents.cabq.gov/environmental-health/airquality/ADM/final%20COA%20Oct2019%20guidelines.pdfNew Mexico Environment Department Air Dispersion Modeling Guidelines, https://www.env.nm.gov/air-quality/modeling-publications/24