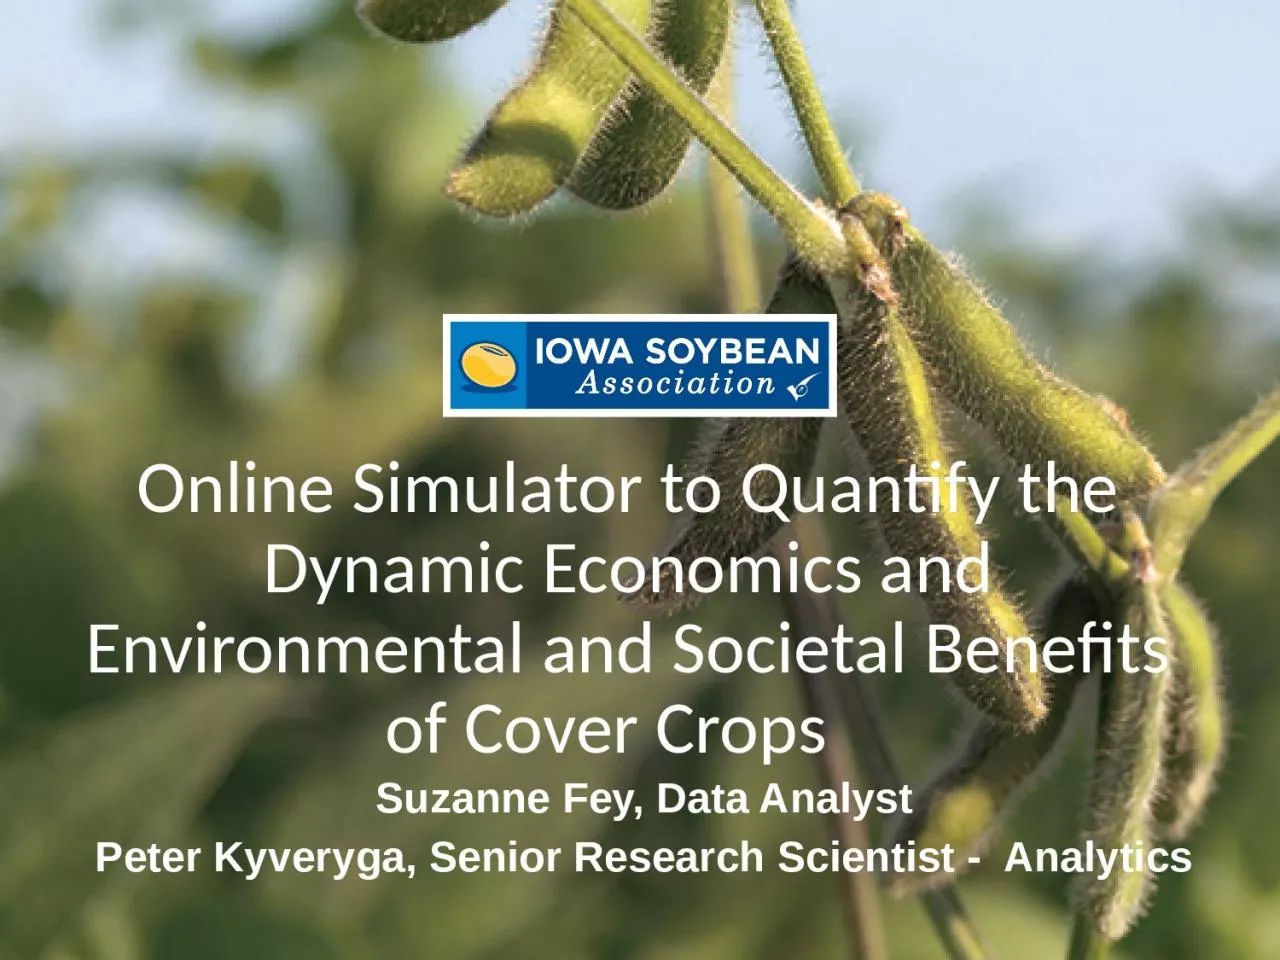
/
Online Simulator to Quantify the Dynamic Economics and Environmental and Societal Benefits Online Simulator to Quantify the Dynamic Economics and Environmental and Societal Benefits

Online Simulator to Quantify the Dynamic Economics and Environmental and Societal Benefits - PowerPoint Presentation

fanny
fanny . @fanny
Follow
65 views
Uploaded On 2023-10-29

Online Simulator to Quantify the Dynamic Economics and Environmental and Societal Benefits - PPT Presentation

Suzanne Fey Data Analyst Peter Kyveryga Senior Research Scientist Analytics Topics Cover Crop Economic simulator Soil Health Test Interpretation Portal for Farmers Interactive Summaries of OnFarm Strip Trials ISOFAST ID: 1026395

yield cover crop cost cover yield cost crop net return values page trials average amp economic results erosion trial

Share:

Link:

Embed:

Download Presentation from below link

Download Presentation The PPT/PDF document "Online Simulator to Quantify the Dynamic..." is the property of its rightful owner. Permission is granted to download and print the materials on this web site for personal, non-commercial use only, and to display it on your personal computer provided you do not modify the materials and that you retain all copyright notices contained in the materials. By downloading content from our website, you accept the terms of this agreement.


Presentation Transcript

1. Online Simulator to Quantify the Dynamic Economics and Environmental and Societal Benefits of Cover Crops Suzanne Fey, Data AnalystPeter Kyveryga, Senior Research Scientist - Analytics

2. Topics:Cover Crop Economic simulatorSoil Health Test Interpretation Portal for FarmersInteractive Summaries of On-Farm Strip Trials - ISOFAST

3. Cover Crop Economic SimulatorThe idea for this simulator came about as part of a larger project to build a: “Soil Health Test Interpretation Portal for Farmers”Funding for the entire project was provided by Iowa Soybean Association and a 2020-2022 Iowa NRCS Conservation Innovation Grant

4. What makes this simulator different?Helps reduce farmer time to research basic cover crop economics and achieve a customized, bottom-line, outcome for their operationHelps raise farmers’ awareness of income and cost mitigation opportunities for cover cropsPromotes significant long-term financial and societal benefits from cover crops that have not always been clearly presented to farmers(Iowa State University and NRCS have spreadsheet calculators)

5. Cell phone navigation to the AppIasoybeans.comSelect Programs,ISA ResearchScroll down to ResultsClick on ResultsClickScroll down to + Cover Crop Net Return Economic Simulator

6. Cell phone version of the appHold vertically to operate PagesHold phone horizontally to read the Net Return Grid

7. Where is the online simulator located?Go to: iasoybeans.com / Research / Results & ToolsSelect: +Cover Crop Net Return Economic SimulatorScroll to the bottom of the tool description and click the launch button:

8. Cover Crop Economic Simulator

9. Cover Crop Economic SimulatorResourceTabs

10. Cover Crop Economic SimulatorPages

11. Cover Crop Economic SimulatorGrid

12. Cover Crop Economic SimulatorSliders

13. Page Navigation – available on all pages

14. Field Size (acres)Cash Crop after CoverAverage yield for this field (bu/acre)(Grid baseline value used in calculations)Grain Market Price ($/bu)(Grid baseline value used in calculations)Reducing Tillage – do not check if you are already no till or are not further reducingDynamic Net Return – Total Net Return value automatically adjusts for any changes made to cost or revenues on pages 1-4(Grid baseline value with no yield change)Page 1: Field and Market Information

15. You have a choice of Annual Cover Crops or Perennial Ground CoverWe targeted four of the most common and successful cover crop options used in Iowa and put them in a dropdown selection listPage 2: Cost to Establish Cover CropResource

16. Page 2 Formula OperationBallpark per acre cost estimates for each step in the process are pre-filled in the interface and all values are directly editable so you can customize costs to more closely match your operationResource

17. Perennial Ground CoverIn three out of four growing seasons, PGC-corn produced equal or better grain yield than conventionally grown controls in central Iowa. Early results were obtained using existing corn hybrids and groundcovers that had not been optimized to work together Additional R&D into breeding, management, and machinery, should provide significant performance increases Opportunities exist for adapting inputs, including groundcover species, corn hybrids and soybean varieties, microbes, endophytes, and machinery, which have value in the marketplace and would provide significant performance increases.Profile of corn growing in PGC. Corn is planted in alternating 15” wide, tilled strips on 30” centers.

18. Perennial Ground CoverThese values are not editable since this work is still in its research phase. If you are interested in learning more, please contact Dr. Cynthia Bartel, Research Scientist at Iowa State University: cabartel@iastate.eduPerennial Ground CoverResource

19. Page 3: Income Opportunities – Fall and/or SpringCover Crop Biomass Grazing or ForageFeeding cover crop biomass to livestock is a familiar and lucrative income option. The tool has options Fall or Spring or both.Resource

20. Page 3: Formula OperationEstimated biomass values differ by following crop and timing.Daily consumption rates per cowDaily feed value(Forage costs to mow, rake and bale are in that formula)Note: Relay cropping into soybean may also enable seed harvest and is included as an income optionResource

21. Page 4: Cost Mitigation Opportunities - State and FederalState and Federal cost share programs cover most costs. Contact your local NRCS/SWCD office for programs available for your fieldsResource

22. Page 4: Cost Mitigation Opportunities – Ecosystem ServicesEcosystem Services companies pay farmers to use cover crops for: carbon sequestration improved water qualityResource

23. Page 4: Cost Mitigation Opportunities – Reduced ErosionCover Crops: benefit soil health, increase soil moisture,improve early season trafficability in wet springs,often lead to higher yields,dramatically reduce erosion

24. Erosion Reduction Value CalculationSOIL LOSS PER ACRE VALUE CALCULATION2007-2020 average erosion Ton/Acre by HUC 12 watershed X 50% erosion reductionX 2020 County average farmland sale priceX 0.001 (approximate depth in inches of one Ton of soil per acre)The watershed layer shows average erosion values between 2007-2020 calculated by Iowa State University through the daily erosion project. The county layer shows 2020 County average land values.

25. Interactive Erosion Reduction MapUnderlying county map with roads and cities; hover to see 2020 average land values.

26. Static Erosion Reduction Map

27. Page 5: Added Value for the Greater GoodThese values do not impact the Page 1 Net ReturnWe have listed a dozen ways in which cover crops contribute to the greater goodThere is no single, established value for the benefits to local communities and society. Page 5 Added Value

28. Reading the Net Return GridCenter (white) row – no yield changeIn this illustration:1st year state cost shareReduced tillage passFall grazing6842-8-6-4-20$4.15$4.30$4.45$4.60$3.40$3.55$3.70$3.85$4.00

29. Baseline Values in the Net Return Grid Center column – base market price$4.00$4.15$4.30$4.45$4.60$3.40$3.55$3.70$3.856842-8-6-4-20

30. Reading the Net Return GridBlue rows –yield increaseRed rows – yield decreaseRight of Center–price increaseLeft of Center– price decrease684-8-62-4-20$4.00$4.15$4.30$4.45$4.60$3.40$3.55$3.70$3.85

31. How Sliders work in the Net Return Grid $4.00$4.15$4.30$4.45$4.60$3.40$3.55$3.70$3.85Default Slider Values:1% bu/ac Yield Change$0.15 $/bu Price Change6842-8-6-4-20

32. How Sliders work in the Net Return Grid $4.00$4.25$4.50$4.75$5.00$3.00$3.25$3.50$3.75Change Slider Values:1.5% bu/ac Yield Change$0.25 $/bu Price Change91263-12-9-6-30

33. Why do we need to simulate Yield Change?Yield Difference (bu/ac)Yield Change (%)The impact of Cover Crops can vary from year to year and field to field.First year results often show a “learning curve”.

34.

35. Key Point Summary The “Net Return Grid” shows a range of possible outcomes due to yield or market changesChoice of several available cost mitigations may help encourage cover crop useSimulations allow quick exploration of ballpark cost/benefit relationships before implementationCustomization of variables brings net return values to the “in field” of the ballparkList of community and social benefits adds motivation beyond personal gains or costs

36. Soil Health Interpretation PortalObjectives:Provide clear explanation of soil health test results to farmersProvide an easy-to-use lab test results upload interfaceEnable set up of free account to retain historical data while still providing the option to close the app without saving the data.Benchmark cover crop management practices across regions.

37. Benchmarking Soil Health

38. Comparison AnalysisWater Extractable OC vs CO2 & SHC

39. Results & InterpretationComparison AnalysisBackgroundFile Configuration & UploadWater Extractable OC vs CO2 & SHCCO2 by CropOC vs CO2Correlation by TreatmentEconomic AnalysisMulti-Year Trials

40. ISOFAST Interactive Summaries of On-Farm Strip Trials It is large – please give it time to load. We are working with ISU top speed it uphttps://analytics.iasoybeans.com/cool-apps/ISOFAST/NAVIGATION PANEL

41. 2-treatment replicated strip trial

42. Yield between strips within each Replication is used to calculate yield response to the experimental treatmentYield Response of each Replication and Trial Mean for Multiple Trial results are pooled by study

43. Navigation Panel

44. Yield Comparisons–43 Priaxor vs Untreated Trials Summarized by YIELD DIFFERENCE by Rep and Trial Mean

45. Trial Summaries & Economics–43 Priaxor vs Untreated Trials Statistically Summarized for probability of a significant resultSelect Confidence IntervalSort by Yield Difference, Rainfall or Trial IDCheck or uncheck years to isolate dataSee count of significant trials that do not cross the zero lineKey results state Study yield response and rangeEconomic analysis provides bottom line information in changing conditions.

46. Trial Summaries & Economics–43 Priaxor vs Untreated Trials Statistically Summarized for probability of a significant resultYield Required to pay for treatment: 2.5 bu/acreThe probability of exceeding the direct application cost:11%Expected average profit exceeding cost: $-4.2 $/acreA range for the expected average profit exceeding cost: $-9.83 to $1.53 $/acre13 of 43 trials had mean yield response above the breakeven value10.0025.00

47. Trial Summaries & Economics–43 Priaxor vs Untreated Trials Statistically Summarized for probability of a significant resultYield Required to pay for treatment: 1.6 bu/acreThe probability of exceeding the direct application cost:92%Expected average profit exceeding cost: $6.00 $/acreA range for the expected average profit exceeding cost: $-1.04 to $13.17 $/acre31 of 43 trials had mean yield response above the breakeven value12.5020.00

48.

49.

50. Questions?sfey@iasoybeans.compkyveryga@iasoybeans.com