/
Challenges of Glaucoma Care in the Himalayas Challenges of Glaucoma Care in the Himalayas

Challenges of Glaucoma Care in the Himalayas - PowerPoint Presentation

faustina-dinatale
faustina-dinatale . @faustina-dinatale
Follow
439 views
Uploaded On 2016-10-26

Challenges of Glaucoma Care in the Himalayas - PPT Presentation

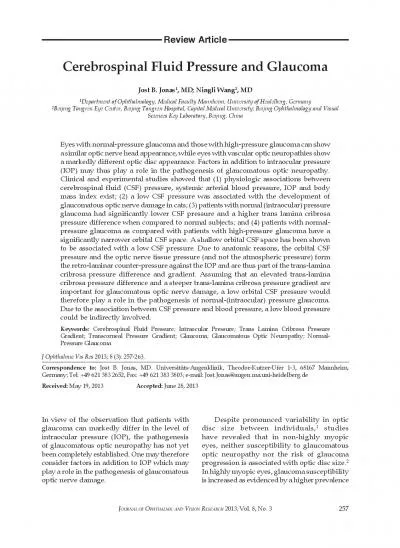
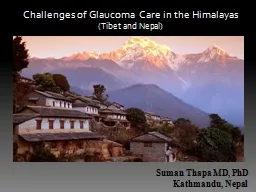
Tibet and Nepal Suman Thapa MD PhD Kathmandu Nepal Worldwide problem Glaucoma S econd leading cause of blindness after cataract Resnikoff WHO 2002 Leading cause of irreversible blindness ID: 480987

eye glaucoma poag pacg glaucoma eye pacg poag blindness nepal training cataract population screening programs 2010 years million iop

Share:

Link:

Embed:

Download Presentation from below link

Download Presentation The PPT/PDF document "Challenges of Glaucoma Care in the Himal..." is the property of its rightful owner. Permission is granted to download and print the materials on this web site for personal, non-commercial use only, and to display it on your personal computer provided you do not modify the materials and that you retain all copyright notices contained in the materials. By downloading content from our website, you accept the terms of this agreement.


Presentation Transcript

Slide1

Challenges of Glaucoma Care in the Himalayas(Tibet and Nepal)

Suman Thapa MD, PhD

Kathmandu, NepalSlide2

Worldwide problem

Glaucoma

S

econd

leading cause of blindness after cataract

(

Resnikoff

, WHO 2002)

Leading

cause of irreversible blindnessSlide3

Blindness from Glaucoma

In 2010, it is estimated that glaucoma will affect approximately 60.5 million

(Quigley, 2006)

59 % will be women

47% will be Asian

Primary open-angle glaucoma → 44.7 million

55% will be women

4.5 million will be bilateral blind (about 10%)

Primary angle closure glaucoma → 15.7 million

70% will be women

87% will be Asian

3.9 million will be bilateral blind (about 25%)

Regarding angle closure glaucoma

More devastating and blinding disease → 3x more than POAG

(Foster, BJO 2001)

Able to treat the pathophysiological mechanism if detected earlierSlide4

TIBET

Blindness and eye diseases in Tibet

15 900 people enumerated (response rate of 79.6%)

Adjusted Prevalence of Blindness

(presenting better eye VA < 6/60) 1.4%

Glaucoma (2.5%).

Cataract (50.7%),

Macular degeneration (12.7%)

Corneal opacity (9.7%).

S Dunzhu et al.

Br J Ophthalmol 2003Slide5

NEPAL

Between China and IndiaPopulation : 26.6 Million (2011)

Area: 147,181 sq. km

Health Budget:

Aprox

. 7 % of the total budget

GDP $450Slide6

Causes of Blindness: Population based studies Comparison 1981 and 2010Slide7

Human Resource & Eye Care Infrastructure in Nepal

1981

2001

2011

Ophthalmologists

7

78

150

Supporting Medical Staff

(Ophthalmic Assistants, Optometrist,

Orthoptists

, Ophthalmic Nurses, Eye Health Workers, Technicians)

4

325

475

General (admin, managers)

5

45

275

Eye Hospitals

1

16

21

Eye Departments

4

6

17

Community (District) Eye Care Centers

0

25

63

Ratio : Population/Ophthalmologist

2m

0.3 m

0.2 mSlide8

Krishna Gopal Shrestha

Eye Hospital = 21

Eye Department = 17

Community Eye Centre = 63

EYE CARE INFRASTRUCTURE IN NEPAL

Slide9

Understanding the burden of Glaucoma

Hospital Based Data (2011)

Results from a Population

Based Study (2010)

Clinical

Information from these data and the Implications

Challenges & Strategies adopted Slide10

Glaucoma Diagnoses ( 1 year) 2011Hospital Based Data

FAR

WEST

(GETA)

MID

WEST

(NGJ)

WEST

#(LEI)CENTRAL(TIO)EAST(LAHAN)

POAG

459 (48.1)

435(48.6)

319 (30.5)

246 (38.2)

1110( 39.4)

PACG

99 (10.4)

297 (33.2)

499 (47.8)

218 (32 )

899 (32.0)

Sec G

377 (39.6)

163 (18.2)

210 (20.2)

86 (19.4)

422 (15.0)

CG

19 (1.9)

-

15 (1.5)

28 (11.4)

28

(14.0)

PACG = POAGSlide11

POAG

PACG

Number

246 ( 38.2 % )

218 ( 32 % )

AGE

65.8

54.6

SEX

M > FF > MIOP31.438.1CDR0.6

0.8

VF DEFECTS

82.5

%

-

VA

> 6/36 (

85%)

(both eyes)

< 3/60 (85.5 %)

(worse eye)

DATA from Tilganga Institute of Ophthalmology, Kathmandu (2011)

79 % PACG were asymptomatic; Sec Glaucoma: NVGSlide12

Population Studies for Blindness

D

esigned specifically to estimate the causes of avoidable blindness: (Cataract, Trachoma, Vitamin A

def

, Trauma)

The

NBS 1981 / RAAB 2010 estimated that glaucoma accounted for 3.8 % & 5.0 % of the total blindness (underestimation, design)Slide13

Population based cross sectional study

ISGEO definitions for glaucoma

Represents a district in Nepal

Bhaktapur Glaucoma Study, Nepal

(2007-2010)Slide14

Results

Prevalence 1.8 %

(95% CI = 1.68 – 1.92)

POAG (1.2 %) > PACG (0.4 %)

Age was a RF (2.4 % : 60-69 years; 10.3% : > 80 years)

No difference in gender

Myopia , HTN, DM were not RFs for POAG

Thapa SS et al. Ophthalmology 2012Slide15

Prevalence of Glaucoma in South Asia


Prevalence %

Study Population

Age

All

POAG

PACG

Ratio of POAG

to PACG

Bangladesh, Dhaka

40 +

3.1

2.5

0.4

6.3

West Bengal, East India

50 +

3.3

3.1

0.2

10.00

ACES, South India

40 +

2.6

1.2

0.5

2.4

APEDS, South India

40 +

-

2.6

1.1

2.4

CGS, South India

40 +

-

1.6

0.9

1.4

Sri Lanka

40 +

1.0

2.3

0.5

4.6

Burma

40 +

-

2.0

2.5

0.8

BGS, Nepal

40 +

1.8

1.2

0.4

3.0

ACES: Aravind Comprehensive Eye Survey

APEDS: Andhra Pradesh Eye Disease Study

CGS: Chennai Glaucoma Study

BGS: Bhaktapur Glaucoma Study

Slide16

Comparison

Age, Sex, IOP, CCT and vCDR

Characteristics

Normal

POAG

P value

PACG

P value

Age

54.60 ( ± 0.20)

68.53 ( ± 1.63)

< 0.001

71.24 ( ± 1.67)

< 0.001

Sex, M / F

1695 / 1994

26/25

0.483

4/13

0.086

IOP

13.30 ( ± 0.04)

13.57 ( ± 0.34)

0.400

16.00 ( ± 1.11)

< 0.001

CCT

537.88 ( ± 0.60)

527.73 ( ± 4.58)

0.053

552.12 ( ± 45.65)

0.11

VCDR

0.26 ( ± 0.002)

0.62 ( ± 0.02)

< 0.001

0.55 ( ± 0.05)

< 0.001

M: Male, F: Female, IOP: Intraocular pressure, CCT: Central Corneal Thickness,

VCDR: Vertical Cup Disc RatioSlide17

Ocular Biometric Measures

Different population based studies

Nepalese

(n = 685)

South Indian

(n = 419)

Chinese

(n = 531)

White

Americans

(n = 170)

African

-

Americans

(n = 188)

Sex (M : F)

315 : 370

210: 209

236 : 295

82 : 88

55 : 133

Axial length (mm)

,

mean (SD)

22.62 (0.90)

22.76(0.78)

23.32(1.38)

23.35(1.38)

23.14(0.87)

95%

CI

difference

in means

- 0.24 to - 0.03

- 0.83 to - 0.57

- 0.90 to - 0.56

- 0.66 to - 0.37

p- value

0.008

< 0.001

< 0.001

< 0.001

.

Thapa SS et al. Optometry and Visual Science 2011Slide18

Demographics of Glaucoma Cases


All (n)

Males

(n)

Females

(n)

M:F Ratio

Median Age

Previously

Diagnosed (%)


POAG

51

26

25

1.04

68.53

2 (3.92)

PACG

17

4

13

0.30

71.23

5 (29.41)

Secondary Glaucoma

7

6

1

6.0

64.00

4 (57.14)

Total

75

36

39

0.92

70.00

11 (14.67)

POAG: Primary- open angle glaucoma, PACG: Primary-angle closure glaucoma

ISGEO Diagnostic

Category (%)

1: Structural and functional evidence

2. Advanced structural damage where reliable field testing is not possible

3. Optic disc not seen

due

of media opacity,

the IOP > 99.5th percentile, evidence of filtering surgery

1

2

3

POAG

45 (

88.24)

5 (

9.80)

1 (

1.96)

PACG

12 (

70.59)

5 (

29.41)

0 (

0.00)

Sec

Gl

2 (

28.57)

4 (

57.14)

1 (

14.29)

Total

59 (

78.67%)

14 (

18.67)

2 (

2.66)Slide19

Visual Acuity Distribution of Glaucoma Cases


N

Visual Acuity


Normal vision (%)

Low vision (%)

Bindness (%)

Age group


40 - 49 Year

4

3 (75.0)

1 (25.0)

0 (0.0)

50 - 59 Year

10

8 (80.0)

2 (20.0)

0 (0.0)

60 - 69 Year

20

15 (75.0)

2 (10.0)

3 (15.0)

70 - 79 Year

31

17 (54.8)

7 (22.6)

7 (22.6)

≥ 80 Year

10

5 (50.0)

1 (10.0)

4 (40.0)

Sex


Male

36

24 (66.7)

5 (13.9)

7 (19.4)

Female

39

24 (61.5)

8 (20.5)

7 (18.0)

Types of Glaucoma


POAG

51

38 (74.5)

6 (11.8)

7 (13.7)

PACG

17

10 (58.8)

4 (23.5)

3 (17.7)

Secondary Glaucoma

7

0 (0.0)

3 (42.9)

4 (57.1)

All

75

48 (64.0)

13 (17.3)

14 (18.7)

Low vision has been defined as a best corrected VA of less than 6/ 18 (20/60, 0.3), but not less than 3/60 (20/400, 0.05) in the better eye. Visual acuity was based on the eye with glaucoma in unilateral cases and on the better eye in bilateral cases.Slide20

Clinical Information

&

ImplicationsSlide21

Normal IOP ≈ 13 mmHg

18 mmHg should be considered on the higher side

Normal v CDR

0.2

0.7 should be viewed with suspicion

CCT influences the measurement of IOPSlide22

85.7 % had IOP within the normal

range

79 % had visual field defects at the time of diagnosis

96

%

had not previously been diagnosed

A

ngle closure glaucoma > 70 % asymptomatic

> 90 % were not aware of Glaucoma

Slide23

Glaucoma

5.2%

total blindness

( >

the estimate of

1981 NBS

: 3.8

% )

Visual morbidity PACG > POAG (3 X )Slide24

Prevalence of Glaucoma in Bhaktapur district

Represents primarily a

Newari

ethnic race

Although the

Newari

’ race constitute a large proportion of the countries population, the results from the BGS does not represent the epidemiology of glaucoma in NepalSlide25

Target population > 60 years,

Opportunistic screening

cataract screening programs

Optic discs have to be examined (0.7 VCDR)

Short axial lengths noted during Biometry for cataract surgery, should undergo gonioscopy

Measuring IOP has a limited role

.

Thapa SS et al. BMC Ophthalmology 2008Separate screening programs for glaucoma are not necessary in Bhaktapur Slide26

Majority ( 70% ) were asymptomatic

(HBS , BGS) Gonioscopy has to be performed for correct diagnosis

High Risk Patients

(HBS, BGS)

Females > 50 years,

short axial

lengths

Severe

visual impairment at presentation (HBS) ( >> POAG)

PACGSlide27

Role of the lens / formation of cataract in the pathogenesis of PACG has to be considered

(BGS)

Early cataract removal may prevent progression to / of PACG in high risk patientsSlide28

Challenges and

Strategies AdoptedSlide29

Burden of Blindness from Glaucoma

in Nepal

88,800 Nepalese 30 years and older have definite glaucoma

Three times more = glaucoma suspects

Almost 400,000 Nepalese have definite or probable glaucoma

2010 Nepal Mid Term Report, Vision 2020Slide30

Aging Population

Geographic terrain

Limited Human Resource

Poverty, Illiteracy

Glaucoma, the disease

ChallengesSlide31

Training Programs for Glaucoma

Ophthalmologist

Residency

Program (1994): University Hospital

Short - term observer training (2005) – 1 month

Glaucoma Fellowship (2013) – 1 year

Slide32

Ophthalmic Assistant Training Program (2001)3 years( ? additional glaucoma training)

OA Glaucoma Training Program (2004)

20 OAs from several community eye centers affiliated to secondary eye hospitals

5

days training, Tertiary Eye Centre

Glaucoma diagnosis, IOP measurement, Optic disc photos, VFsSlide33

Objective

Detect glaucoma & refer patients to the secondary eye hospitalsFAILED

Training duration : short

Problems in monitoring the outcome after the training

Redesigning the training program

To start with OAs working in CECs belonging to our institute

Longer duration of trainingSlide34

Screening

Large Population Screening Costs , Infrastructure

Tools for screening

Case

Detection / Opportunistic ScreeningSlide35

Opportunistic screening in 1 day cataract screening clinics in the villages

(2006)

Clinic 1

Clinic 2

Clinic 3

Total number

318

180

298

≥ 50 years

99 (31%)

85(47%)

99 (33%)

POAG

2

1

3

PACG

2

1

2

SUSPECTS

10

6

7

Suspects attended hospital

8

6

7

Suspects diagnosed

2

1

1Slide36
Slide37

TreatmentBeta blockers: 1

st line of treatmentAdditional drugs

: Issues regarding costs

Primary Surgery

Ask patients about affordability Slide38

Glaucoma Education & Awareness Programs

(2003)

Glaucoma Support Group Activiti

es

-

6 education classes / year

Annual Glaucoma Awareness Week

- Free investigations and treatment - Information BookletsSlide39

Impact of GSG and Awareness Programs

(2004- 2011)

Total

number

of patients examined during

Glaucoma Awareness Week

Financial support extended by patients attending support group classes towards the treatment of patients

Number of participants during patient

education programsSlide40

3 year Prospective, Surgical Trial

To evaluate the outcomes of Cataract removal vs. Trabeculectomy or Combined surgery in the treatment of ACG

Bhaktapur Retinal Study

(BRS,

2013- 2017)

Diabetic Rp, AMD, Venous occlusions

5 year Follow Up of BGS patients (Longitudinal / Prospective

Cohort)

Nepal Angle Closure Glaucoma Study

(NACGS, 2012 -2015)

Research Slide41

Conclusion

What we know

Glaucoma

blindness will increase with

aging population

PACG

causes more visual morbidity than

POAG

What we should focus on Case Detection & Opportunistic Screening Treatment, economics Slide42

Raising awareness on glaucoma Training Human Resource

Research

What

we hope to

expect

Cataract

intervention programs

:

Can

it help prevent ACG at its early stage and prevent ACG blindness?Slide43

Tertiary Level

Glaucoma Specialists

General Ophthalmologists

Sub-specialty Service

(programs)

11 CECs

OAs

1

Secondary Level Hospital

General Ophthalmologist

2 CEC

OAs

Validate OA Training Programs

Case detect at community level

Promote AwarenessSlide44

Bauddhanath,

Kathmandu, Nepal Slide45

2003

One of the first with a Fellowship in Glaucoma in Nepal

Glaucoma Fellowship at RVEEH, Melbourne

Prof Hugh Taylor

Trained under 6 glaucoma specialists in one institutionSlide46

Raising awareness on glaucoma Training Human ResourceResearch

What we hope to expect

Cataract intervention programs

Could it help prevent ACG at its early stage and prevent ACG blindness?Slide47

Achievement

Description

1981

2010

Prevalence of Blindness

0.84 %

0.39 %

Number of Eye Hospital

1

21

PEC/ CEC

0

63

Ophthalmologist

5

147

Cataract Prevalence

72 %

65%

Retinal disorder due to Diabetic

NA

10000

Description

Existing

Required

Gap

Ophthalmologist

150

570

420

Optometrist

36

570

534

Ophthalmic Assistant

275

1,140

565

Trained PHC Workers

201*

5,700

Gap of Human Resource Slide48

POAG – 2.5%

PACG – 0.4%

(Foster, 1996)

?

?

?

POAG – 2.0%

PACG – 2.5%

(Casson, 2007)

POAG – 2.3%

PACG – 0.5 %

(Casson, 2009)

South Asia

?

Glaucoma Blindness

7.1 %

(2007)

POAG –1.2 %

PACG – 0.4 %

(Thapa, 2010)Slide49

Females, > 60 years of age, short axial lengths

could develop PACG

LPI, Early cataract extraction

can be considered in high risk patients

Slide50

POAG – 0.41%

PACG – 4.62%

(Jacob, 1998)

POAG – 1.62%

PACG – 0.9 %

(Vijaya, 2005/6)

POAG – 1.62%

PACG – 1.08%

(Dandona, 2000)

POAG – 1.7%

PACG – 0.5%

(Ramakrishnan, 2003)

IndiaSlide51

Glaucoma in India Estimated burden of disease

Approximately 11.2 million persons aged > 40 with glaucoma

POAG is estimated to affect 6.5 million persons

PACG is estimated to affect 2.5 million persons

George R et al. J Glaucoma 2010Slide52

Demographic Profile

Total Sample Size : 4800; ≥ 40 years

Male: Female = 51 : 48 %

Ethnic Race : Newar, 70 %Slide53

Methods

Applanation

tonometry,

gonioscopy

FDP, Dilated pupil examination

Axial

length measurements

HFA

Thapa SS et al. Clinic Exp Ophthal 2010Slide54

POAG

Prevalence > PACG (BGS)

VI < PACG

IOP - > 90 % within normal range

(BGS)

- Raised IOP

(HBS)

Secondary Glaucoma

NVG & Lens Induced