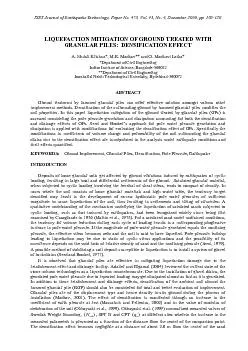
/
LIQUEFACTION MITIGATION OF GROUND TREATED WITH GRANULAR PILES:  DENSIF LIQUEFACTION MITIGATION OF GROUND TREATED WITH GRANULAR PILES:  DENSIF

LIQUEFACTION MITIGATION OF GROUND TREATED WITH GRANULAR PILES: DENSIF - PDF document

faustina-dinatale
faustina-dinatale . @faustina-dinatale
Follow
470 views
Uploaded On 2015-08-26

LIQUEFACTION MITIGATION OF GROUND TREATED WITH GRANULAR PILES: DENSIF - PPT Presentation

106 Liquefaction Mitigation of Ground Treated wcompaction piles SCPs but the increase depends on the fines content Figure 1 Densification by RGP causes increase in deformation moduli and decrease ID: 116051

106 Liquefaction Mitigation Ground

Share:

Link:

Embed:

Download Presentation from below link

Download Pdf The PPT/PDF document "LIQUEFACTION MITIGATION OF GROUND TREATE..." is the property of its rightful owner. Permission is granted to download and print the materials on this web site for personal, non-commercial use only, and to display it on your personal computer provided you do not modify the materials and that you retain all copyright notices contained in the materials. By downloading content from our website, you accept the terms of this agreement.


Presentation Transcript

LIQUEFACTION MITIGATION OF GROUND TREATED WITH GRANULAR PILES: DENSIFICATION EFFECT *Department of Civil Engineering **Department of Civil Engineering Jawaharlal Nehru Technological University, Hyderabad-500072 106 Liquefaction Mitigation of Ground Treated wcompaction piles (SCPs) but the increase depends on the fines content (Figure 1). Densification by RGP causes increase in deformation moduli and decrease in the coefficients of permeability and volume change. Further, the densification effect decreases with distance from the center of the compaction point and may become negligible at the periphery of unit cell. Thus, the coefficients of horizontal permeability, , and volume change, , of the soil around the granular pile can be considered to vary with from the center of the pile. Fig. 1 Relation between the distance from the pile center and increase in the SPT N value In this paper the pore pressure generation and dissipation of the treated ground under earthquake conditions is analyzed to quantify the densification effect of ground treatment with RGP. Theory of pore-water pressure generation and dissipation developed by Seed and Booker (1977) is applied, with some modifications for evaluating the densification effect of RGPs, to the analysis of columnar gravel drains under a variety of earthquake conditions. Linear variations of the coefficients of permeability and volume Ground improvement by means of granular piles/stone columns/geopiers, which is associated with partial substitution of the in-situ soil, originated in 1960s. Ground with granular piles provides increased bearing capacity, significant reduction in settlement, free drainage, increase in liquefaction resistance, etc. Granular piles are installed by vibro-compaction, vibro-replacement, cased bore hole (rammed stone columns/RGPs), or by simple auger-boring methods (Datye and Nagaraju, 1981; Balaam and Booker, 1981). RGPs are installed in the ground by partial or full displacement methods and by ramming in stages, using a heavy falling weight, within a ‘pre-bored casing’ or ‘driven closed-end casing’ and retracting the casing pipe stepwise. In the latter case, driving of closed-end tube itself densifies the surrounding soil. Ramming action of the falling weight tends to ram the stone into the sides of the hole, which further densifies and reinforces the ground. Liquefied and not-liquefied subsoil conditions of two reclaimed islands in Kobe City after the 1995 Hyogoken-Nambu earthquake were investigated by Yasuda et al. (1996). They identified that the subsoil treated with sand compaction piles or rod (vibro) compaction did not liquefy and subside even though the earthquake shaking was very strong (Figure 2). Tsukamoto et al. (2000) examined the changes in the state of stress due to static sand-compaction-pile penetration in densifying loose to medium dense soils and presented a chart for evaluating the improved or modified SPT N values (after treatment) in terms of replacement ratio and initial SPT N (before treatment) values ported the densification of coarse-grained soils by vibratory compaction through discussion of (i) the variation of the coefficient of earth pressure in normally consolidated and over-consolidated sands, and (ii) the effect of soil compaction on the change of ISET Journal of Earthquake Technology, December 2006 107 Fig. 2 Comparison of ground subsidence in zones treated with different methods (after Yasuda Fig. 3 Diagram for the evaluation of increase in SPT N-value (after Tsukamoto et al., 2000) Densification and reinforcement effects cause modifications in the properties of the in-situ soil. This densification and modification in the soil parameters of the ground is not uniform over the entire zone of surrounding ground and is function of the distance from the point of densification. During the process of 108 Liquefaction Mitigation of Ground Treated winstallation of RGPs, the soil adjacent to and in the vicinity of the point of treatment gets densified most. granular pile, is maximum near the periphery of the pile and decreases with the distance from the pile. Densification by RGPs causes increase in the deformation moduli and decrease in the coefficient of permeability and coefficient of volume Sujatha (1998) analyzed several field-test data and postulated linear and exponential variations of the stiffness of soil with distance as limits for the densification effect. Similar variations are considered for the reduction of flow and deformation parameters of the in-situ soil (i.e., coefficients of permeability and volume change). This reduction is maximum at the point of densification and decays with distance towards the periphery of the unit cell, with the parameters reaching their original in-situ values at the As a consequence of densification, a linear variation of the coefficient of horizontal permeability, with distance from the center of RGP is considered, with becoming minimum at the edge of RGP and maximum at the periphery of the unit cell (Figure 4). The expression for the coefficient of permeability at distance r from the centre of the granular pile considering linear variation ()()sbsahsakrrak=−+ (1) and are the coefficients of permeability at the edges of RGP and unit cell respectively. Non-dimensionalizing Equation (1) with , the initial in-situ value of the coefficient of permeability, one gets kbkakka rraR=−+ (2) hkkkR sbkbkkR, and hisakakkR k s b r k (r) Fig. 4 Variation of coefficient of permeability of soil with distance Similarly, the expression for linear variation of the coefficient of volume change, vbvavvamrram=−+ (3) ISET Journal of Earthquake Technology, December 2006 109 and are, respectively, the coefficients at distances and from the centre. Non-dimensionalizing Equation (3) with , the initial in-situ value of the coefficient of volume change, one mbmamvma rraR=−+ (4) In most practical cases, the horizontal permeability of a sand deposit is much higher than its vertical permeability and the spacing between vertical drains is closer than the distance required for pore water to drain vertically towards the free surface. Furthermore, many natural deposits of sand are interspersed with narrow horizontal layers of relatively impermeable silt, which may severely inhibit vertical drainage. For these reasons the dominant mechanism in the operation of a gravel drain system is often one of pure For flow into gravel drain, assuming pure radial flow and constant coefficients of permeability and volume compressibility , the governing equation for the phenomenon can be written as (Seed uuuNmrrrtNt ∂∂∂+=− ∂∂∂∂ (5) is the excess pore pressure at radial distance r from the centre, is time, is the unit weight of water, is the peak excess hydrostatic pore-water pressure generated by the earthquake, is the number of cycles, and 2-1sin cos§·§·¨¸¨¸©¹©¹ (6) In Equation (6), , the pore pressure ratio; = the initial mean bulk effective stress for axisymmetric conditions or the initial vertical effective stress for simple shear conditions; is the number of cycles required to cause liquefaction; and is an empirical constant characterizing the shape of the pore pressure generation curve and is a function of the soil properties with a typical value of 0.7. The irregular cyclic loading induced by an earthquake is converted (Seed et al., 1975) into an equivalent number, , of uniform cycles at an amplitude of 65% of the peak cyclic shear stress, i.e. at , occurring over time-duration (7) 1. Assumptions and Limitations It is assumed that the flow of the pore water is governed by Darcy’s law; the coefficients of permeability and compressibility remain constant; drainage or flow is horizontal; and the granular filler material is far more permeable than the surrounding sand layer. Following are the limitations of the method by Seed and Booker (1977). Infinite gravel drain permeability is assumed so that no excess pore water pressures are developed in the columns. The smear resistance is not accounted for and so is the case with the possible clogging of the drain due to the migration of fine sediments towards the drain due to pore pressure generation. This model applies to low pore pressure ratio values where a linear process of consolidation is valid. This process assumes the coefficient of compressibility to be constant. 110 Liquefaction Mitigation of Ground Treated w2. Recent Related Studies Design diagrams by Onoue (1988) and Iai and Koizumi (1986) incorporated the effects of drain resistance in the analyses of Seed and Booker (1977). Baez and Martin (1992) presented an evaluation of the relative effectiveness of stone columns for the mitigation of liquefaction of soil. Pestana et al. (1998) analysed the development of excess pore pressure in a layered soil profile, accounting for vertical and horizontal drainage with a non-constant ‘equivalent hydraulic conductivity’, and head losses due to horizontal flow into the drain and also the presence of a reservoir directly connected to the drain were considered. Boulanger et al. (1998) evaluated the drainage capacity of stone columns or gravel drains for mitigating liquefaction hazards. The governing equation of the model by Seed and Booker (1977) (Equation () is modified to include the densification effect of RGP in dissipating the excess pore-water pressure. In the ground treated with RGP, coefficient of permeability and coefficient of volume compressibility are r Consider an element of soil, in polar coordinates as shown in Figure 5, through which laminar flow occurs. Using Darcy’s law, from the expression for the flow in the radial direction, the basic flow krkrhhhSerrrrret∂∂∂∂++=∂∂∂∂+∂ (8) Using the stress-strain relations and definitions of coefficient of compressibility and coefficient of volume change (fully-saturated case), ettt +∂∂∂ (9) From Equation ( and with wuh = excess pore pressure, w = unit weight of water), Equation ()(())()()wvwvkrkruuuumrrrrmrrrtt ∂∂∂∂∂++=−∂∂∂∂∂∂ (10) and are as defined in Equations (1) and (3) respectively. Considering the rate of t , as the rate of pore pressure generation, one may write tNt (11) The final form of Equation (10) therefore becomes, ()(())()()wvwvkrkruuuuNmrrrrmrrrtNt∂∂∂∂∂++=−∂∂∂∂∂∂∂ (12) Equation (12) is a more generalized equation considering all forms of non-homogeneity. In non-dimensional form, with normalized pore pressure , which is same as the pore pressure ratio , Equation (12) becomes ()(())()()wvwvkrkrWWWWNmrrrrmrrrtNt∂∂∂∂∂++=−∂∂∂∂∂∂∂ (13) Non-dimensionalising the terms r and via () and Ttt respectively, Equation (13) becomes ISET Journal of Earthquake Technology, December 2006 111 ()()()()kbdkmvmvRRTRRWWWWRRRRRRRRRTN∂∂∂∂++=−∂∂∂∂∂∂ (14) 2-1sin cos §·§·¨¸¨¸©¹©¹ (15) hid (16) Equation (14) is nonlinear and hence is solved numerically using a finite-difference approach, which involves discretizing the unit cell radially into a number of elements, for the appropriate boundary and (r) d q r r o q r Fig. 5 Flow through a soil element 1. Boundary Conditions The material in the drain is far more permeable than the surrounding sand layer. So the excess pore-water pressure in the drain is effectively zero, i.e., at r or baR or (Gravel drain is infinitely permeable). At the outer boundary of the unit cell, due to symmetry, the pore-water pressure or 1 R , 0 ru (17) 2. Initial Condition At or , pore pressure at all the nodes in the soil is equal to the average of pore water pressure generated over the initial time period of (or ), i.e., average of the pore-water pressure generated over the initial cycle at 0at 0arc sin (18) 112 Liquefaction Mitigation of Ground Treated w3. Limitations The assumptions and limitations associated with the original model of Seed and Booker (1977) are carried to the new model also. The smear effect is commonly included through a reduction in the permeability. However, the limitations due to the assumption of infinite permeability for the drain and neglect of the possible clogging of the drain with sediments still remain. Under the assumption of purely radial flow, the pore pressure ratio, , throughout the sand depends on the dimensionless parameters: = ratio representing the geometric configuration of the = cyclic ratio characterizing the severity of the earthquake shaking, in relation to the liquefaction characteristics of the sand; , relating the duration of the earthquake to the consolidation , a parameter characterizing the shape of the pore pressure generation curve. It is found that for many materials, fits the experimental data well, and this value is adopted (Seed et and) that are functions of radial distance r defining the variations of coefficient of horizontal permeability and volume compressibility of soil, respectively. 1. ‘No Densification’ Case for Validation If the coefficients of permeability and volume change of the surrounding soil are unchanged due to the installation of RGP, this represents the ‘No Densification’ case. In this case the ambient soil will have and (i.e., kakbmambRRRR ===). This condition of ‘No Densification’ is identical to the solution of Seed and Booker (1977). The effect of ratio on maximum pore water pressure in the present study is shown in Figure 6 for the cyclic ratio of 2 and a range of (0.1 to 0.4), with = 1, along with the results obtained by Seed and Booker (1977) for the similar conditions but by using the finite element program LARF (Liquefaction Analysis for Radial Flow). Maximum pore pressure ratio , i.e. the maximum value of , throughout the layer is plotted . This figure provides a comparison between the solutions of the finite element method of Seed and Booker (1977) and the present finite-difference method. The results obtained in the present study agree closely with the results of Seed and Booker (1977). Small deviations discernible between the two solutions may be due to the method of solution and due to the time-step involved. Moreover, it is observed that the deviations decrease with an increase in the area ratio. For the cyclic ratio equal to 2, if no drains are present )0(ba, the soil liquefies at )(1leqlNNT . It is observed from the figure that, for , initial liquefaction is deferred for a period of T but eventually occurs at about . The liquefied state, , continues until the end of the period of strong shaking. Thereafter it decreases as pore-water pressure dissipates. It can be observed that at higher values, initial liquefaction may be prevented as the maximum pore pressure ratio decreases with an Effect of cyclic ratio on the maximum pore pressure ratio, without densification effect, is shown in Figure 7. A range of cyclic ratio, , from 1 to 5 with = 0.3 and = 1 is considered. As cyclic ratio increases, pore water pressure increases and leads to liquefaction depending on the generation and dissipation of pore pressures. The time at which the ground liquefies decreases with an increase in the cyclic ratio as per 1()leqlTNN. If attained, the liquefied state continues until the end of the period of strong shaking, i.e., T . Thereafter, the pore pressure ratio decreases gradually. It can be observed from Figure 7 that the peak value of increases from about 0.27 to 0.52 for an increase in leqNN ISET Journal of Earthquake Technology, December 2006 113from 1 to 2. For the values of 3, 4 and 5, reaches a value of unity at the values of about 0.62, 0.35 and 0.24, respectively. 0.1110 ........ Seed & Booker 1977 Present study0.40.30.250.2 a/b = 0.1 = 2max 0.04 0.1 1 10 0 0.5 1 T (t / t a / b = 0.3 = 1 = 5 max 2. Densification Case Densification effect on the maximum pore pressure ratio with respect to change only in the coefficient of volume change (i.e., no change in the coefficient of permeability shown in Figures 8 and 9. Figure 8 shows the effect of densification at the near end, no modification in the coefficient of volume change at the farthest end . A range of from 114 Liquefaction Mitigation of Ground Treated w0.1 to 1 is considered with and 2 . It can be observed that the maximum pore pressure ratio decreases with decrease in ; it decreases from 0.525 to 0.375 for a decrease from 1 to 0.1. The effect of densification at the farthest end is shown in Figure 9, considering densification at the near end, , as 0.3. A range of from 0.5 to 1 is considered with and . It can be observed that decreases from 0.41 to 0.25 for a from 1 to 0.5. It can be concluded from Figures 8 and 9 that densification effects with respect to the coefficient of volume change reduce the pore pressures and mitigate the liquefaction 0.04 0.1 0 0.2 0.4 0.6 T(t / tmax a/b = 0.3 = 1 = 2 =1 =1 R = 1 0.8 0.6 0.5 0.3 0.1 Fig. 8 Densification effect with respect to the compressibility coefficient at the near end on 0.04 0.1 0 0.2 0.4 0.6 T ( t / t a/b = 0.3 = 1 = 2 =1 =0.3 = 1 = 10.8 0.6 0.5 maxFig. 9 Densification effect with respect to the compressibility coefficient at the farthest end on ISET Journal of Earthquake Technology, December 2006 115Densification effect on the maximum pore pressure ratio in terms of change only in the coefficient of permeability, i.e., no change in the coefficient of volume change ication at the near end, , for no modification in the coefficient of permeability at the farthest end , is shown in Figure 10. A range of from 0.5 to 1 is considered with and 2 . It may be observed that increases from 0.525 to 0.675 for a decrease in from 1 to 0.8. For the maximum pore pressure ratio reaches unity, which corresponds to the liquefied state. Further decrease in will reduce the time to attain the liquefied state. The effect of densification at the farthest end on the maximum pore pressure ratio is shown in Figure 11, considering densification at the near end, , as 0.6. A range of from 0.6 to 1 is considered with bdT .0 and 2 . It can be observed that the maximum pore pressure ratio is slightly affected by densification at the farthest end, . It can be concluded from Figures 10 and 11 that densification effect with respect to the coefficient of permeability increases the pore pressures. This observation is revealing in that densification with respect to the coefficient of permeability alone results in a negative effect. 0.04 0.1 0 0.5 1 T ( t / tmax a/b = 0.3 = 1 = 2 =1 =1 =1 (No Densification) 0.8 0.6 0.5 Fig. 10 Densification effect with respect to the permeability coefficient at the near end on Figure 12 shows the densification effect on the maximum pore pressure ratio with respect to both the coefficients of permeability and volume change at the near end. In this case the coefficients of permeability and volume change at the farthest end remain unaffected . A range of from 0.3 to 1 is considered with bdT .0 and . Equal densification effect is considered for both and . It may be observed that the maximum pore pressure ratio increases from 0.525 to 0.62 for a decrease in and from 1 to 0.8. becomes almost equal to 1, i.e., the ground attains liquefied state, at T for . Further reductions in and reduce the time The effect of densification at the farthest end, with respect to both coefficients of permeability and volume change , on the maximum pore pressure ratio is shown in Figure 13, while 116 Liquefaction Mitigation of Ground Treated wconsidering densification at the near end as . This is done for both and ranging between 0.7 and 1. attains the value of unity, indicating the liquefaction state, at T for kbmb, i.e., for no densification at the farthest end. Densification at the farthest end, associated with reduction in and (from 1 to 0.7), reduces (from about 1 to about 0.57) and thus establishes that liquefaction of ground is mitigated by overall densification of the ground. 0.04 0.1 0 0.5 1 T (t / tmax a/b = 0.3 = 1 = 2 =0.6 =1 = 1 (No Densification) =1 0.80.6 Fig. 11 Densification effect with respect to the permeability coefficient at the farthest end on 0.04 0.1 0.5 1 T ( t / tmax a/b = 0.3 = 1 = 2 =1 = R =1 (No densification) 0.8 0.60.5 0.3 Fig. 12 Densification effect with respect to the coefficients of compressibility and permeability ISET Journal of Earthquake Technology, December 2006 117 0.04 0.1 0 0.5 1 T (t/ tmax a/b = 0.3 = 1 = 2 =0.6 =1 (No densification) =1 0.9 0.8 0.7 Fig. 13 Densification effect with respect to the coefficients of compressibility and permeability Practical applicability of the proposed model is illustrated by solving a typical practical situation with reasonable input parameters. Consider a soil layer having the properties, = 9.81 kN/m = 10 m/s = 7.13 kN/m, and subjected to an earthquake ground motion that is represented by 24 uniform stress cycles in a period of 70 s. It is known that under undrained conditions (i.e., with no granular drains or RGP), the soil would liquefy under this sequence of stress application after 12 cycles so . If granular piles of 0.6 m diameter are installed at 2 m center to center spacing ( = = 1.0 m), then hidwviktmbb-5×70/(9.81×7.13×10-5)]/1.0 If densification effect is not considered, the maximum pore pressure ratio generated is observed to be 0.52 (Figure 12). If densification effect is considered in terms of reductions in the values of permeability and compressibility to 0.8 times of their initial values at the periphery of the granular pile (i.e., at the near end) and no reductions at the farthest end, the maximum pore pressure ratio generated will increase to 0.62. It may also be observed from Figure 12 that if the densification effect reduces the permeability and compressibility values to 0.6 times the initial values or lower, the maximum pore pressure ratio will reach unity, thus indicating the initiation of liquefaction. Similar mechanisms operate in the ground treated with vibrated granular piles that are installed by the vibro-replacement process. In this case the densification caused by vibration may affect the flow and compressibility parameters. Modified permeability and compressibility values should then be considered for the effective analysis of pore pressure generation and dissipation. An analysis of ground treated with granular piles (stone columns), while considering the effect of installation in densifying the ground, has been proposed. Both the coefficients of volume change and permeability are considered to be affected due to densification by RGP. The reality however is that both the coefficients decrease because of densification. The densification effect decreases with the distance from the point of densification. Hence, linear variations have been adopted for the coefficients of permeability and volume change with distance. A new model has been proposed by incorporating the above variations into the classical model by Seed and Booker (1977), to include the densification effect of rammed granular piles. Pore pressure generation and dissipation in the modified ground have been studied for a range of parameters considered for the densification effect. Maximum pore pressure ratio has been 118 Liquefaction Mitigation of Ground Treated wfound to decrease with closer spacing of gravel drains and to increase with increase in the cyclic ratio . Densification effect on the coefficient of volume change alone has been found to be positive in that the maximum induced pore pressure ratio gets reduced. Densification effect with respect to the coefficient of permeability alone increases the maximum pore water pressure ratio, thus becoming a negative effect. Densification effect with respect to both coefficients of permeability and volume change becomes a slightly negative or positive effect, depending on the relative degrees of densification with respect to compressibility and permeability. Ground treated with vibro-stone columns too would show similar effects, though the quantification of the change in the state of in-situ stress remains an intractable phenomenon to model at the present juncture. The following symbols are used in this paper: = radius of the granular pile = radius of the unit cell = granular pile = horizontal permeability of treated ground = horizontal permeability of untreated ground =coefficient of volume compressibility of treated ground = coefficient of volume compressibility of untreated ground = number of stress cycles associated with any period of earthquake shaking = equivalent number of uniform stress cycles induced by earthquake = number of uniform stress cycles required to cause liquefaction R = non-dimensionalized radial distance (= br = radial distance measured from the center of granular pile = sand compaction pile SPTN = standard penetration test number SPTN = SPTN T = normalized time, = time = dimensionless time factor = duration of earthquake = excess hydrostatic pressure = excess hydrostatic pressure generated by earthquake shaking = pore pressure ratio = maximum value of pore pressure ratio throughout the layer at a given = initial mean bulk effective stress 1. Adalier, K. and Elgamal, A. (2004). “Mitigation of Liquefaction and Associated Ground Deformations by Stone Columns”, Engineering Geology, Vol. 72, No. 3-4, pp. 275-291. ISET Journal of Earthquake Technology, December 2006 1192. Baez, J.I. and Martin, G.R. (1992). “Quantitative Evaluation of Stone Column Techniques for Earthquake Liquefaction Mitigation”, Proceedings of the 10th World Conference on Earthquake 3. Balaam, N.P. and Booker, J.R. (1981). “Analysis of Rigid Rafts Supported by Granular Piles”, International Journal for Numerical and Analytical Methods in Geomechanics, Vol. 5, No. 4, pp. 379-4. Boulanger, R.W., Idriss, I.M., Stewart, D.P., Hashash, Y. and Schmidt, B. (1998). “Drainage Capacity of Stone Columns or Gravel Drains for Mitigating Liquefaction” in “Geotechnical Earthquake Engineering and Soil Dynamics III (edited by P. Dakoulas and M. Yegian)”, Geotechnical Special Publication No. 75, American Society of Civil Engineers, Reston, U.S.A. 5. Datye, K.R. and Nagaraju, S.S. (1981). “Design Approach and Field Control for Stone Columns”, Proceedings of the 10 International Conference on Soil Mechanics and Foundation Engineering, Stockholm, Sweden, Vol. 3, pp. 637-640. 6. Iai, S. and Koizumi, K. (1986). “Estimation of Earthquake Induced Excess Pore Water Pressure for Gravel Drains”, Proceedings of the Seventh Japan Earthquake Engineering Symposium, Tokyo, 7. Madhav, M.R. (2001). “Engineering of Ground for Earthquake Disaster Mitigation”, Proceedings of 8. Martin, G.R., Finn, W.D.L. and Seed, H.B. (1975). “Fundamentals of Liquefaction under Cyclic Loading”, Journal of the Geotechnical Engineering Division, Proceedings of ASCE, Vol. 101, 9. Massarsch, K.R. and Fellenius, B.H. (2002). “Vibratory Compaction of Coarse-Grained Soils”, 10. Murali Krishna, A. (2003). “Liquefaction Mitigation of Loose Sand Deposits by Rammed Granular Piles”, MTech Thesis, Indian Institute of Technology Kanpur, Kanpur. 11. Ohbayashi, J., Harda, K. and Yamamoto, M. (1999). “Resistance against Liquefaction of Ground Improved by Sand Compaction Pile Method” in “Earthquake Geotechnical Engineering (edited by P.S. Seco e Pinto)”, A.A. Balkema, Rotterdam, The Netherlands. 12. Onoue, A. (1988). “Diagrams Considering Well Resistance for Designing Spacing Ratio of Gravel 13. Pestana, J.M., Hunt, C.E., Goughnour, R.R. and Kammerer, A.M. (1998). “Effect of Storage Capacity on Vertical Drains Performance in Liquefiable Sand Deposits”, Proceedings of the Second International Conference on Ground Improveme14. Seed, H.B. (1979). “Soil Liquefaction and Cyclic Mobility Evaluation for Level Ground during Earthquakes”, Journal of the Geotechnical Engineering Division, Proceedings of ASCE, Vol. 105, 15. Seed, H.B. and Booker, J.R. (1977). “Stabilization of Potentially Liquefiable Sand Deposits Using Gravel Drains”, Journal of the Geotechnical Engineering Division, Proceedings of ASCE, Vol. 103, 16. Seed, H.B., Idriss, I.M., Makdisi, F. and Banerjee, N.G. (1975). “Representation of Irregular Stress Time Histories by Equivalent Uniform Stress Series in Liquefaction Analyses”, Report UCB/EERC-75/29, Earthquake Engineering Research Center, University of California, Berkeley, U.S.A. 17. Seed, H.B., Lysmer, M.J. and Martin, P.P. (1976). “Pore-Water Pressure Changes during Soil Liquefaction”, Journal of the Geotechnical Engineering Division, Proceedings of ASCE, Vol. 102, 18. Sujatha, K.P. (1998). “Analysis of Reinforcement and Densification Effects in Improved Ground”, MTech Thesis, Indian Institute of Technology Kanpur, Kanpur. 19. Tsukamoto, Y., Ishihara, K., Yamamoto, M., Harada, K. and Yabe, H. (2000). “Soil Densification due to Static Sand Pile Installation for Liquefaction Remediation”, Soils and Foundations, Vol. 40, 120 Liquefaction Mitigation of Ground Treated w20. Yasuda, S., Ishihara, K., Harada, K. and Shinkawa, N. (1996). “Effect of Soil Improvement on Ground Subsidence due to Liquefaction”, Soils and Foundations, Special Issue on Geotechnical Aspects of the January 17, 1995 Hyogoken-Nambu Earthquake, pp. 99-107.