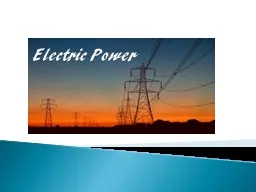
Tuesday October 11 2011 Session 31 Electricity Demand Modeling and Capacity Planning USAEEIAEE North American Conference Washington DC Nidhi R Santen Massachusetts Institute of Technology ID: 759688
Download Presentation The PPT/PDF document "U.S. Electric Power Generation Planning ..." is the property of its rightful owner. Permission is granted to download and print the materials on this web site for personal, non-commercial use only, and to display it on your personal computer provided you do not modify the materials and that you retain all copyright notices contained in the materials. By downloading content from our website, you accept the terms of this agreement.
Slide1
U.S. Electric Power Generation Planning under Endogenous Learning-by-Searching Technology Change
Tuesday, October 11, 2011Session 31: Electricity Demand Modeling and Capacity PlanningUSAEE/IAEE North American Conference, Washington DCNidhi R. Santen, Massachusetts Institute of Technology (nrsanten@mit.edu)Mort D. Webster, Massachusetts Institute of Technology David Popp, Syracuse University/National Bureau of Economic Research
Slide22
Introduction (1 of 2)
EIA, AER 2009; EIA 2011
Slide33
Introduction (2 of 2)
Power System Technology R&D
(Public and Private)
GovernmentMakes Environmental Policies
Electric UtilitiesBuild Power Plants Using Available Generation Technologies
Natural
Environment
1. Constraining Regulations
2. Production Support
Direct
R&D Support
New or Improved Generation Technologies
Increased Demand for Technologies
CO2 Emissions
Two main policy pathways to reduce
cumulative
power sector emissions
“Now v. Later”
“Adoption v. Innovation”
Slide44
Research Question and Outline
Research Question:
What
is
the socially
optimal balance
of inter-temporal regulatory policy and
technology-specific
R
&D
expenditures for the
U.S. electricity generation
sector, given a
specific cumulative climate target?”
Outline for Today’s Presentation
Overview of existing electricity sector planning models’ capabilities
Introduction of the current modeling framework
Snapshots from first results
Future research
Summary
Slide55
1. Overview of Existing Numerical Power Generation Expansion Models (1 of 2)
Top-Down v. Bottom-up ModelsTop-Down: Use Average Costs and Assume Capacity FactorsBottom-Up: Use Specific Costs (e.g., Capital, O&M, Fuel) and Solve for Capacity FactorsRigorously studying emissions potentials from the power sector requires modeling operational details of the physical system (more easily resolved in bottom-up models).
Including Operational Realism Matters!
Results Preview – Less Detail
Results Preview – More Detail
Slide66
1. Overview of Existing Numerical Power Generation Expansion Models (2 of 2)
Common Methods to Model Technology Change and Learning DynamicsDecision Variables: Capacity Additions1. (Exogenous) Fixed Trend:CapCostt,g = CapCostt-1,g*(1+ α)2. (Endogenous) Learning-by-Doing:CapCostt,g = InitialCapCostg / (CapitalStockt,g)LBDCoeffDecision Variables: Capacity Additions + R&D Investments3. (Endogenous) Learning-by-Searching:CapCostt,g = InitialCapCostg / (KnowledgeStockt,g)LBSCoeff KnowledgeStockt,g = δΣ1:t-1R&D$t,g + R&D$t,g4. 2-Factor Learning Curves (2FLC):CapCostt,g = InitialCapCostg / [(CapitalStockt,g)LBDCoeff2 * (KnowledgeStockt,g)LBSCoeff2] KnowledgeStockt,g = δΣ1:t-1R&D$t,g + R&D$t,g
Numerical Models
Representation of
Technology
Improvement
Fixed
Time Trends (Exogenous)
Learning by Doing (Endogenous)
Learning by Researching (Endogenous)
NREL ReEDS
X
X
Gen
Star Lite
(Ramos et. al./IIT)
X
SMART
(Powell et. al)
X
MIT EPPA
(Electricity
Sector)
X
(Modified)
IIASA ERIS (Electricity Sector)
X
(Limited)
EPA/MIT
MARKAL
(Electricity)
X
Slide77
Knowledge Stock (H)
R&D$
New Knowledge (
h)
Generation Planning Inputs
Generation Technology Costs ($/MWh)
Electricity Demand (MW/time)
Generation Technology Availability (Year)
Learning by Experience
Technology Change Module “Innovation Possibilities Frontier”
h
t
= aRD$bHΦ
Environmental Policy
New Power Plant Additions
(GW)
Production (
GWh)
Learning by Researching
2. Modeling Framework for this Research
Generation
Planning Model
CO2 Emissions (Million Metric Tons)
Generation
Planning Model
H
t
,g
=
(
1-δ
)
H
t
-1,g
+
h
t,g
Slide88
2. Modeling Framework for this Research
Structural DetailsCentralized, social planning (decision-support model)Representative technologies of the U.S. systemRepresentative U.S. load duration curve50-year planning horizon, 10-year time stepsObjective Decision Variables (per period) (1) R&D $ (by Technology) (2) Carbon Cap (3) Generation Expansion (4) Generation OperationKey Constraints (1) All traditional generation expansion constraints (e.g., demand balance, reliability, non-cycling nuclear technology, etc.) (2) Cumulative carbon cap (3) Cumulative R&D funding account balance
Generation Technologies
Coal
Steam
GasWind
Advanced CoalGas CCNuclearSolar
Coal w CCSGas CTHydroOther
Slide99
3. First Results: With and Without Learning-by-Searching (under a Medium Cumulative Emissions Target)
No LBS
With LBS (NPVLBS < NPVNoLBS)
Slide1010
3. First Results: Medium v. Strong Cumulative Emissions Target
Medium Target
Strong Target
Slide1111
3. First Results: Sensitivity of Innovation Possibilities Parameters (Strong CCS Possibilities under a Medium Emissions Target)
Base Case Innovation Possibilities
Strong CCS Innovation Possibilities
Slide1212
4. Future Research
Model optimal generation (carbon cap distribution) and R&D investment decisions under multiple uncertain innovation possibilities using stochastic dynamic programming
Slide1313
Summary
Studying how to balance regulatory efforts and R&D efforts for the electricity generation sector requires a decision model where the capital costs of technology change endogenously with respect to new builds (adoption)
and
new research (innovation
)
Rigorous study of emissions management from the power sector requires operational details of the physical system, embodied within bottom-up type models
.
Results
confirm both a “tradeoff” and “interaction” between adoption v. innovation for technologies with strong learning potentials (dynamics that are popular in the theoretical literature
)
More research needs to be done to 1) understand the sensitivity of innovation parameters on decisions, 2) compare these results with more traditional knowledge stock formulations, and 3) model the effect of uncertainty of returns to research on near-term regulatory and R&D decisions.
Slide14Thank You
14
Source: US EPA E-Grid Database & NPR.org
Slide15Barreto, L. and S. Kypreos. (2004). “Endogenizing R&D and market experience in the "bottom-up" energy-systems ERIS model,” Technovation, 24(8):615-629.Fischer, C. and R. G. Newell. (2008). “Environmental and technology policies for climate mitigation.” Energy Economics 55: 142-162.Hobbs, B. F. (1995). “Optimization methods for electric utility resource planning.” European Journal of Operational Research 83:1-20.Ibenholt, K. (2002). “Explaining learning curves for wind power,” Energy Policy 30: 1181-1189.Jaffe, A., and M. Trajtenberg. (2002). Patents, citations, & innovations: a window on the knowledge economy. MIT Press: Cambridge, MA, 478pp. Johnstone, N., Hascic, I, and D. Popp. (2010). “Renewable Energy Policies and Technological Innovation: Evidence Based on Patent Counts,” Environmental Resource Econ, 45: 133-155.Messner, S. (1997). “Endogenized technological learning in an energy systems model,” J Evol Econ 7: 291-313.Miketa, A. and L. Schrattenholzer. (2004). “Experiments with a methodology to model the role of R&D expenditures in energy technology learning processes.” Energy Policy, 32(15):1679-1692.Popp, D. (2002). “Induced Innovation and Energy Prices.” American Economic Review 92(1): 160-180.Popp, D. (2006). “ENTICE-BR: Backstop Technology in the ENTICE Model of Climate Change.” Energy Economics 28(2): 188-222.Popp, D. (2006b). “They Don't Invent Them Like They Used To: An Examination of Energy Patent Citations Over Time.” Economics of Innovation and New Technology 15(8): 753-776.
15
References
Title Slide Photo Credits
(from left to right): (1)
www.scientificamerican.com
(2)
http://www.pelamiswave.com
(3) Sandia National Labs (4)
http://www.metaefficient.com
(5)
http://img.dailymail.co.uk
(6)
https://inlportal.inl.gov