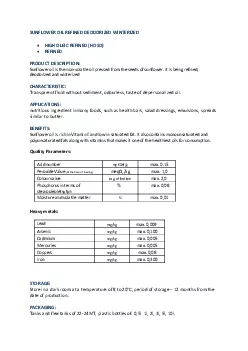
/
Using Aerogravity to Produce a Refined Vertical Datum Using Aerogravity to Produce a Refined Vertical Datum

Using Aerogravity to Produce a Refined Vertical Datum - PowerPoint Presentation

faustina-dinatale
faustina-dinatale . @faustina-dinatale
Follow
348 views
Uploaded On 2018-10-24

Using Aerogravity to Produce a Refined Vertical Datum - PPT Presentation

DR Roman and X Li XXV FIG Congress 1621 June 2014 Kuala Lumpur Malaysia Session TS01A Paper 7303 Gravity Field Power Spectrum Power Spectrum plot of gravity field blue line Most power is at longest ID: 695710

2014 june session lumpur june 2014 lumpur session paper ts01a fig congress malaysia kulala 7303 xxv data aerogravity gravity

Share:

Link:

Embed:

Download Presentation from below link

Download Presentation The PPT/PDF document "Using Aerogravity to Produce a Refined V..." is the property of its rightful owner. Permission is granted to download and print the materials on this web site for personal, non-commercial use only, and to display it on your personal computer provided you do not modify the materials and that you retain all copyright notices contained in the materials. By downloading content from our website, you accept the terms of this agreement.


Presentation Transcript

Slide1

Using Aerogravity to Produce a Refined Vertical Datum

D.R. Roman and X. Li

XXV FIG Congress

16-21 June 2014

Kuala Lumpur, Malaysia

Session TS01A, Paper 7303Slide2

Gravity Field Power Spectrum

Power Spectrum plot of gravity field (blue line). Most power is at longest

wavelengths (λ) at left on the lowest degree harmonics, where satellite

(light blue bar) data dominate. Surface data (brown bar) contain the shortest

to the right. Aerogravity (green bar) overlaps both parts of spectrum (red boxes).

17 June 2014, Session TS01A, Paper 7303

2

XXV FIG Congress, Kulala Lumpur, Malaysia 16-21 June 2014Slide3

GRAV-D Aerogravity (07 June 2014)Gravity for the Redefinition of the American Vertical Datum

Map Key - Airborne Gravity Data

Green: Available data and metadata

Blue: Data being processed

Orange: Data collection underway

White: Planned for data collection

http://www.ngs.noaa.gov/GRAV-D/data_products.shtml

17 June 2014, Session TS01A, Paper 7303

3

XXV FIG Congress, Kulala Lumpur, Malaysia 16-21 June 2014Slide4

GRAV-D Aerogravity Collection

Aircraft: rotating between King Air, Pilatus, P-3Equipment: GPS, IMU, & gravity metersData sampling: 1 HzNominal Flight elevation: 6.1 km (20 kft

)

Nominal air speed: 407

kmh

(220 knots)Track spacing: 10 km track (50 km crossovers)Typical block: 400 x 500 km (41 profiles)Nominal spectral band: 20-400 km17 June 2014, Session TS01A, Paper 73034

XXV FIG Congress, Kulala Lumpur, Malaysia 16-21 June 2014Slide5

EN06 – Collected over Maine

EN06 Aerogravity (Beta vers.)

Biases by Profile

w.r.t

. EGM2008

17 June 2014, Session TS01A, Paper 7303

5

XXV FIG Congress, Kulala Lumpur, Malaysia 16-21 June 2014Slide6

Profiles for 3 regions (no bias)

Each profile is essentially independent

Spatially correlated systematic features between profiles

Likely error sources are in surface gravity:

Near shore (altimetry)

Onshore follows topoBack bay areas17 June 2014, Session TS01A, Paper 7303

6XXV FIG Congress, Kulala Lumpur, Malaysia 16-21 June 2014Slide7

Zoom into Great lakes and NE

(GPSBMs are too dense, will block maps)

17 June 2014, Session TS01A, Paper 7303

7

XXV FIG Congress, Kulala Lumpur, Malaysia 16-21 June 2014Slide8

Airborne vs. Surface Gravity

Cleaning of gravity dataSecond transition bandRemove biases w.r.t aerogravity (normalize)Makes surface data consistent with aerogravity

Preserves short wavelength in surface

17 June 2014, Session TS01A, Paper 7303

8

XXV FIG Congress, Kulala Lumpur, Malaysia 16-21 June 2014Slide9

Impact of GRAV-D Aerogravity(xGEOID14B - xGEOID14A)

17 June 2014, Session TS01A, Paper 7303

9

XXV FIG Congress, Kulala Lumpur, Malaysia 16-21 June 2014

Mean = 0.0 cm STDEV = 0.5 cm MIN = -42.8 cm MAX = 34.6 cmSlide10

unit

Cnm_T

(Ref)

Cnm_Z00

(

Ref+Airborn)Ref+Airborn+SurfaceNo.AK.XGeoid14B

cmstdstdstd

#points

Gulf Coast9.93

9.26

9.23(240)

482

PRVI11.7010.37

10.49(240)10.25(480)

57

Great Lakes10.72

10.68

10.56(240

)

2116

North East

3.81

2.99

3.30(240)

3.19(360)

3.04(480)

2.97(600)

168 (Altimetry problem ?)

GSVS11

1.86

1.08

1.37 (240)

1.07(480

)

218

CA11 (45N,36N,234W,241W)

11.64

11.27

11.21(240)

581

Lake Michigan (47N,40N,270W,278W)

7.55

7.48

7.44(240)

1777Slide11

Outlook

30 June 2014 Beta release of xGEOID14A/BLook for links on the NGS Main or GEOID pagesIncorporates aerogravity from 20 regionsFirst experimental model using aerogravity

Annual releases to follow (roughly same time)

Data cleaning: 2,000,000 surface gravity in 1400 different surveys

Eventual usage as vertical datum in 2022

17 June 2014, Session TS01A, Paper 730311

XXV FIG Congress, Kulala Lumpur, Malaysia 16-21 June 2014Slide12

Contact Information

Daniel R. Roman, National Geodetic Survey Chief (acting) SRSD/GRAV-D P.I./Geoid Team Leaddan.roman@noaa.gov

301-713-3200 x103

Relevant NGS

webpages:Geoid Page: http://www.ngs.noaa.gov/GEOID/GRAV-D: http://www.ngs.noaa.gov/GRAV-D/17 June 2014, Session TS01A, Paper 7303

12XXV FIG Congress, Kulala Lumpur, Malaysia 16-21 June 2014Slide13

Gulf Coast

17 June 2014, Session TS01A, Paper 7303

XXV FIG Congress, Kulala Lumpur, Malaysia 16-21 June 2014

13Slide14

California

17 June 2014, Session TS01A, Paper 7303XXV FIG Congress, Kulala Lumpur, Malaysia 16-21 June 2014

14Slide15

Great Lakes through Northeast U.S.

17 June 2014, Session TS01A, Paper 7303

XXV FIG Congress, Kulala Lumpur, Malaysia 16-21 June 2014

15Slide16

Puerto Rico & USVI

17 June 2014, Session TS01A, Paper 7303

XXV FIG Congress, Kulala Lumpur, Malaysia 16-21 June 2014

16