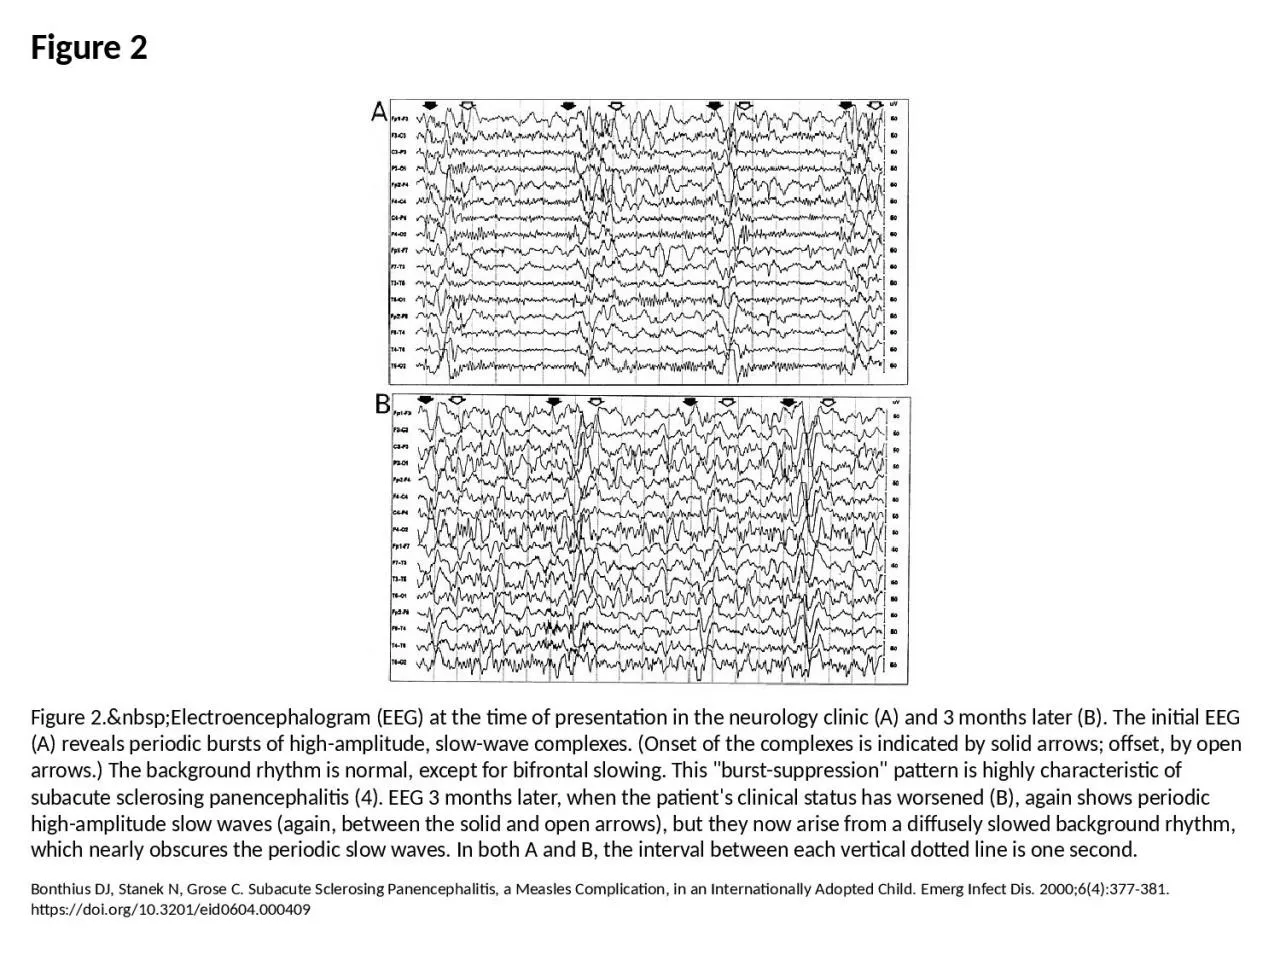
PPT-Figure 2 Figure 2. Electroencephalogram (EEG) at the time of presentation in
Author : finley | Published Date : 2024-02-03
Bonthius DJ Stanek N Grose C Subacute Sclerosing Panencephalitis a Measles Complication in an Internationally Adopted Child Emerg Infect Dis 200064377381 httpsdoiorg103201eid0604000409
Presentation Embed Code
Download Presentation
Download Presentation The PPT/PDF document "Figure 2 Figure 2. Electroencep..." is the property of its rightful owner. Permission is granted to download and print the materials on this website for personal, non-commercial use only, and to display it on your personal computer provided you do not modify the materials and that you retain all copyright notices contained in the materials. By downloading content from our website, you accept the terms of this agreement.
Figure 2 Figure 2. Electroencephalogram (EEG) at the time of presentation in: Transcript
Download Rules Of Document
"Figure 2 Figure 2. Electroencephalogram (EEG) at the time of presentation in"The content belongs to its owner. You may download and print it for personal use, without modification, and keep all copyright notices. By downloading, you agree to these terms.
Related Documents