/
Comparisons of Synthetic Populations Generated From Census 2000 and American Community Comparisons of Synthetic Populations Generated From Census 2000 and American Community

Comparisons of Synthetic Populations Generated From Census 2000 and American Community - PowerPoint Presentation

freakapple
freakapple . @freakapple
Follow
345 views
Uploaded On 2020-07-01

Comparisons of Synthetic Populations Generated From Census 2000 and American Community - PPT Presentation

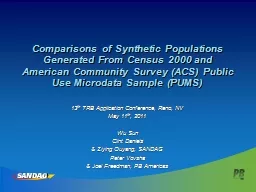
13 th TRB Application Conference Reno NV May 11 th 2011 Wu Sun Clint Daniels amp Ziying Ouyang SANDAG Peter Vovsha amp Joel Freedman PB Americas Presentation Outline Project Background ID: 792062

popsyn acs census year acs popsyn year census results household estimates 2009 data 2000 amp pums sandag person control

Share:

Link:

Embed:

Download Presentation from below link

Download The PPT/PDF document "Comparisons of Synthetic Populations Gen..." is the property of its rightful owner. Permission is granted to download and print the materials on this web site for personal, non-commercial use only, and to display it on your personal computer provided you do not modify the materials and that you retain all copyright notices contained in the materials. By downloading content from our website, you accept the terms of this agreement.


Presentation Transcript

Slide1

Comparisons of Synthetic Populations Generated From Census 2000 and American Community Survey (ACS) Public Use Microdata Sample (PUMS)

13th TRB Application Conference, Reno, NVMay 11th, 2011Wu SunClint Daniels& Ziying Ouyang, SANDAGPeter Vovsha& Joel Freedman, PB Americas

Slide2

Presentation OutlineProject Background

SANDAG PopSynFeatureScenariosMethodologyGeographiesKey stepsControl variablesData SourcesValidationsResults AnalysisConclusions

Slide3

Project BackgroundSANDAG & SANDAG Travel ModelsSANDAG PopSyn & ABM

What is a PopSyn?What role does a PopSyn play in an ABM?

Slide4

SANDAG PopSyn Development

PopSyn II

PopSyn

I

PopSyn I

Based on Atlanta PopSyn

Updated controls and programming

No person level controls

PopSyn II

Slide5

PopSyn II FeaturesFormulated as an entropy-maximization problemBalance person and household controls simultaneously

Applicable to both Census 2000 and ACS dataUpdated household weight discretizing stepAdded household allocation from TAZ to small geographyDatabase-driven and OOD

Slide6

PopSyn ScenariosYear 2000 PopSynYear 2008

PopSynFuture year PopSyn(s)

2000

Census Base Year

2010

2008 ACS

Base Year

2050

Future Years

Slide7

An entropy-maximization problem by Peter Vovsha

Subject

to

constraints:

α

i

Where

i

= 1, 2….I Household

and person controls

Set

of households in the PUMA

A priori

weights assigned in the PUMA

Zonal

controls

α

i

Coefficients

of contribution of household to each control


Methodology

Slide8

PopSyn GeographiesMGRA (33,000)

TAZ (4,605)PUMA (16)

Slide9

SANDAG PopSyn Key Steps

Create Sample HHsBalance HH Weights

Discretize HH Weights

Allocate HHs

Validate PopSyn

Create control targets

Create validation

measures

Slide10

Control VariablesHousehold level controlsHousehold size (1,2,3,4+)

Household income (5 categories)Number of workers per household (0, 1, 2, 3+)Number of children in household (0, 1+)Dwelling unit type (3 categories)Group quarter status (4 categories)Person level controlsAge (7 categories)Gender (2 categories)Race (8 categories)

Slide11

Data SourcesCensus and ACS PUMSHousehold and person level microdata

Census and ACS summary dataSource for base year control targetsSource for base year validation dataSANDAG estimates and forecastsSource for future year control targets

Slide12

ACS Vs. Census

ACS

Census

Frequency

Every year

Every 10 years

Data Collected

Both SF1 and SF3 data

SF1: number of people, age, race, gender, etc.

SF3: income, education, disability status, etc.

Estimates

Period estimates

"Point-in-time" estimates

Sample Size

1 in 40 households

Short form SF1: 100% count

Long form SF3: 1 in 6 households

1-year PUMS: 1%

3-year PUMS: 3%

5-year PUMS: 5%

PUMS: 5% sample

Slide13

Why ACS?Advantages

Timeliness: a new set of data every year for areas that are large enough (population > 65,000). DisadvantagesBased on a smaller sample associated with increased error compared with decennial Census. ‘Period estimates’ vs. ‘Point in time’. Which year does the ACS PUMS data represent?

Slide14

ValidationsObjectivesCompare PopSyn against Census or ACS

Number of validation measuresYear 2000: 96Year 2008: 86Variables used as universesNumber of householdsNumber of personsControlled variablesNon-Controlled variables

Slide15

Validation StatisticsMean percentage differenceStandard DeviationsAbsolute values vs. percentage values

Geography: PUMA

Slide16

Results

HHID

HH Serial #

GeoType

GeoZone

Version

SourceID

HH Serial #

PUMA

Attributes

Allocated Household Table

PUMS Person Table

PerID

HH Serial #

Attributes

PUMS Household Table

Slide17

Results-Validation Excerpt

Label

Description

PopSyn

Census

Mean Diff.

Standard Dev.

1

number of HHs

985938

992681

-0.6%

0.9%

6

size 1

24.2%

24.2%

-0.4%

1.5%

7

size 2

32.3%

32.0%

0.8%

1.0%

8

size 3

15.9%

16.1%

-1.8%

2.0%

9

size 4

27.7%

27.7%

-0.7%

3.3%

Slide18

Census 2000 Population Density

Slide19

Results-Examples(I)

Slide20

Results-Examples(II)

Slide21

Results-Examples(III)

Slide22

Results-Examples(IV)

Slide23

Results-Household Characteristics

Slide24

Results-Person Characteristics

Slide25

Results-Summary(I)

Mean Diff. Range by PUMA

Census 2000

ACS

2005-2009

>-2% & <2%

40/96

28/86

>-5% & <5%

59/96

50/86

>-10% & <10%

78/96

67/86

>-20% & < 20%

87/96

84/86

Slide26

Results-Summary(II)ACS-Based vs. Census-Based PopSyn(s)Both produced acceptable results

Census PopSyn performed better than ACS PopSyn in validation measuresConsistency between targets and validation dataCensus PopSyn: both from Census summaryACS PopSyn: targets from estimates, validation data from ACS summaryTarget accuracy at small geography is the key

Slide27

Results-Software PerformanceTest environmentDell Intel Xeon PC with dual 2.69 GHz processors and 3.5 GB of RAMPerformance

Year 2000

Year 2008

Runtime

11.8 min

14.1 min

SynPop Pop

2.77mil

2.95mil

SynPop HHs

0.99mil

1.05mil

Slide28

Issues and Future Work

IssuesConsistency of various geographiesCensus/ACS geographyTransportation modeling geographyLand use modeling geographyAccuracy of land use estimates and forecasts at small geographiesFuture WorkAdd worker occupations as controlsImprove control target accuracyAutomate control target generations

Slide29

ConclusionsClosed form formulation provides a sound theoretical basisBalance household and person controls simultaneously

Applicable to both ACS and Census dataAn early application using 2009 ACS 5-year dataDatabase-driven and OOD makes software easy to maintain, expand, and transfer

Slide30

AcknowledgementsThe authors thank SANDAG staff:

Daniel Flyte, Ed Schafer, Eddie Janowicz, For their help in this project, especially in providing control target data.

Slide31

Questions & ContactsQuestions?ContactsWu Sun:

wsu@sandag.orgZiying Ouyang: zou@sandag.orgClint Daniels: cdan@sandag.org

Slide32

ACS 1-, 3-, and 5- Year Estimates

Data collected between...Data pooled to produce

Data published for areas with

Jan.

1, 2009 and

Dec.

31, 2009

2009 ACS 1-year estimates

populations of 65,000+

Jan.

1, 2007 and

Dec.

31, 2009

2007-2009 ACS 3-year estimates

populations of 20,000+

Jan.

1, 2005 and

Dec.

31, 2009

2005-2009 ACS 5-year estimates

populations of almost any size

Slide33

ACS PUMS 2009 5-Year Estimates for San Diego County

ACS YearHouseholds

Persons

2005

11,107

27,811 (No GQ)

2006

12,302

29,129

2007

12,058

28,286

2008

12,230

28,599

2009

12,180

28,497

Total

59,877

114,511

Census Year

Households

Persons

2000

52,774

134,866