/
20 th  Century Thermodynamic Modeling of Automotive Prime Mover Cycles 20 th  Century Thermodynamic Modeling of Automotive Prime Mover Cycles

20 th Century Thermodynamic Modeling of Automotive Prime Mover Cycles - PowerPoint Presentation

fullyshro
fullyshro . @fullyshro
Follow
345 views
Uploaded On 2020-06-13

20 th Century Thermodynamic Modeling of Automotive Prime Mover Cycles - PPT Presentation

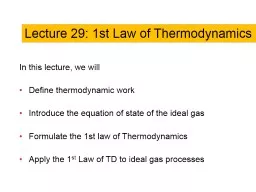
P M V Subbarao Professor Mechanical Engineering Department Respect True Nature of Substance Cycle Performance Parameters Net Work Transfer onto piston This is work done by working fluid on the piston also called as Indicated Work ID: 777152

Share:

Link:

Embed:

Download Presentation from below link

Download The PPT/PDF document "20 th Century Thermodynamic Modeling of..." is the property of its rightful owner. Permission is granted to download and print the materials on this web site for personal, non-commercial use only, and to display it on your personal computer provided you do not modify the materials and that you retain all copyright notices contained in the materials. By downloading content from our website, you accept the terms of this agreement.


Presentation Transcript

Slide1

20th Century Thermodynamic Modeling of Automotive Prime Mover Cycles

P M V SubbaraoProfessorMechanical Engineering Department

Respect True Nature of Substance…..

Slide2

Cycle Performance Parameters

Net Work Transfer onto piston :

This is work done by working fluid on the piston, also called as Indicated Work.

Indicative Performance:

Slide3

Specific Fuel Consumption

XSFC – specific fuel consumption (kg/kWh)

.

X must always be specified when reporting these values (i.e., I for indicated)

Fuel consumption of an engine reported in L/h or kg/h because these values ignore engine load. A better measure of fuel consumption is,

Slide4

Specific Fuel Consumption Variations

ISFC – indicated specific fuel consumptionBSFC - brake specific fuel consumptionPSFC – PTO specific fuel consumption

DSFC – drawbar specific fuel consumption

Slide5

Fuel conversion efficiency (

η

f)


With units

Also called brake thermal efficiency

Major efforts to make it higher

If power = brake power


Brake thermal efficiency

If power = indicated power (net)


Indicated thermal efficiency

Brake power measurement using dynamometer

Indicated power measurement using pressure vs crank angle indicator diagram

Slide6

Indicated power

Mechanical indicator

P-

θ

diagram

Indicator diagram

θ

pressure

Firing

Non-firing

Pressure vs crank angle measurement

Motoring curve

Modern method: Electronic indicator

Piezo-electric pressure transducer for pressure, rotating disc with marked magnetic strips for

θ

Indicator drum connected to crank-shaft

Stylus movement by cylinder pressure force against calibrated spring

k*x = P*A, where k = spring constant, x = stylus movement, A = indicator piston area

Slide7

Brake power

Engine

Load

Output shaft

Principle of Dynamometer

Brake Power = Load

Various methods to create the load and hence various dynamometers

R

Friction face

If frictional force = FR,Work done in one revolution against frictional force W = 2πR*FR

Torque balance,

F*b = FR*RThen work per revolution

W = 2πF*bWork per unit time (Power) Pb = W*N = 2πF*b*N

N = rev. per second of crankshaft

Classification of Dynamometers:Absorption Dynamometers – Power absorbed and usually dissipated as heat by some means. E.g. Prony brake, Rope brake, Hydraulic, Eddy current dynamometer etc.Transmission Dynamometers – Power is transmitted to an external load after measuring it on some scale. E.g. Torque meters, Electrical generators etc.

Brake and dynamometer are used interchangeably

Slide8

Indicative Mean Effective Pressure:

Actual Fuel- Air Ratio :


Stoichiometric Fuel- Air Ratio :

Parameters for Performance Diagnosis

Slide9

Use of MEP to calculate power

MEP


Power


For convenience

n = number of power strokes per minute

=


=

r.p.m

./2 for four-stroke

=

r.p.m

. for two-stroke

Power


MEP = P (just pressure)

By knowing typical range of MEP for a category of engines and knowing engine dimensions, rotational speed and type of cycle:

Power can be deduced

BMEP

Naturally aspirated SI engines

Turbocharged SI Engines

Naturally aspirated 4-stroke CI engines

Turbocharged 4-stroke CI engines

At Max. Power

850 – 1050 kPa

1250 – 1700 kPa

700 – 900 kPa

1000 – 1200 kPa

ME

P measures the success of engine designer in producing work for a given displaced volume

Slide10

Mechanical efficiency

Brake power =


Defined in terms of gross power

Pumping work is also defined as a loss

Specific fuel consumption (

sfc

)


Lower values are desirable

Since brake power is used, also called brake specific fuel consumption (

bsfc

)

Mass flow rate of fuel to engine (kg/s)


Combustion efficiency

- Heating value of fuel


- Actual heat input to the engine from combustion


Slide11

Fuel Air Equivalence Ratio:

For fuels with C, H and O


Air-fuel-ratio (AFR) =


stoichiometric air-fuel ratio


Slide12

Selection of Mixture Strength

Air Standard Model

Actual Performance curve

Fuel-air Model

Slide13

Selection of Mixture Strength

Air Standard Model

Actual Performance curve

Fuel-air Model

Slide14

Selection of Sufficient Air : Minimization of Running Cost

14

Slide15

Selection of Sufficient Air : Running Cost

Vs Capital Cost

15

Slide16

Optimizing Engine Performance

Engines are most efficient at or near peak load.Efficiency drops with a reduction in torque load.At zero brake torque, all fuel energy is expended in engine friction.

Lower rated engine speeds provide lower BSFC, and at the same time reduce torque reserve – design compromise.

Slide17

Outline of A Modern Engine Intake Port

Slide18

Enhanced Flow Area due to Twin valves

Slide19

Enhancement of Intake Flow Area using Twin Valves