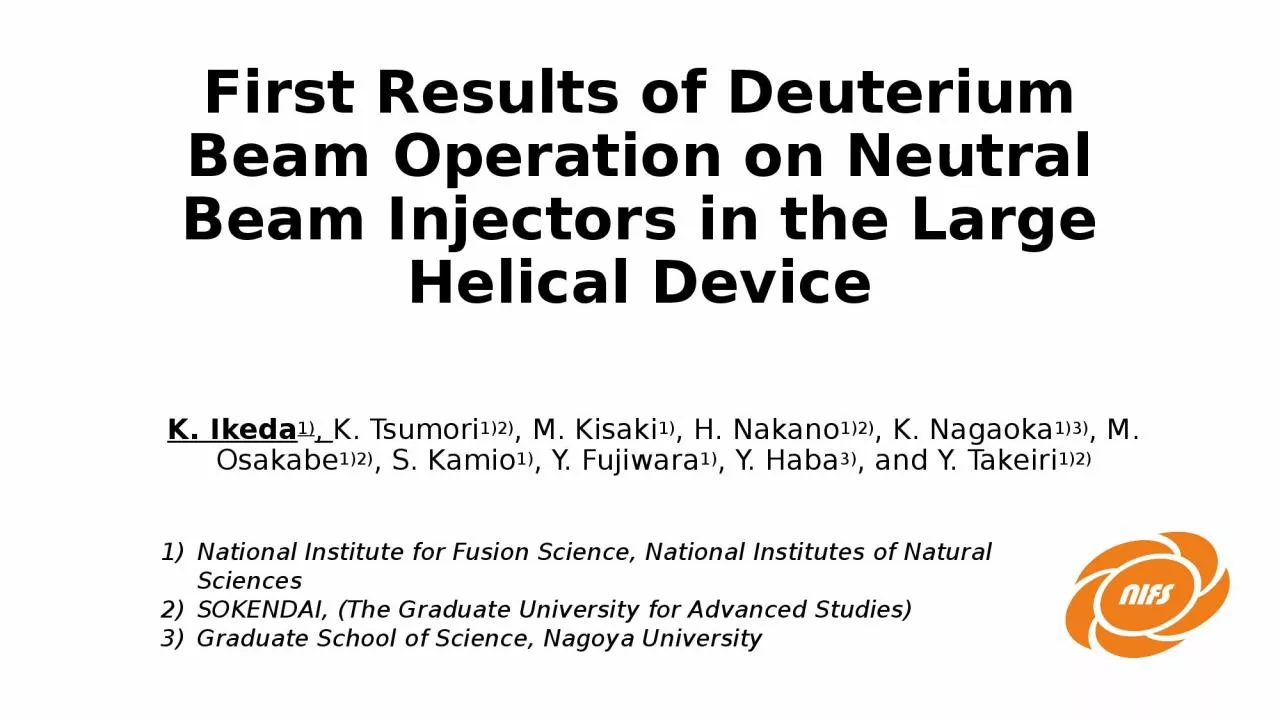
/
First Results of Deuterium Beam Operation on Neutral Beam Injectors in the Large Helical First Results of Deuterium Beam Operation on Neutral Beam Injectors in the Large Helical

First Results of Deuterium Beam Operation on Neutral Beam Injectors in the Large Helical - PowerPoint Presentation

gelbero
gelbero . @gelbero
Follow
342 views
Uploaded On 2022-06-11

First Results of Deuterium Beam Operation on Neutral Beam Injectors in the Large Helical - PPT Presentation

K Ikeda 1 K Tsumori 12 M Kisaki 1 H Nakano 12 K Nagaoka 13 M Osakabe 12 S Kamio 1 Y Fujiwara 1 Y Haba 3 and Y ID: 916089

operation beam current nbi beam operation nbi current power deuterium kev injection electron high ratio gas ion lhd discharge

Share:

Link:

Embed:

Download Presentation from below link

Download Presentation The PPT/PDF document "First Results of Deuterium Beam Operatio..." is the property of its rightful owner. Permission is granted to download and print the materials on this web site for personal, non-commercial use only, and to display it on your personal computer provided you do not modify the materials and that you retain all copyright notices contained in the materials. By downloading content from our website, you accept the terms of this agreement.


Presentation Transcript

Slide1

First Results of Deuterium Beam Operation on Neutral Beam Injectors in the Large Helical Device

K. Ikeda1), K. Tsumori1)2), M. Kisaki1), H. Nakano1)2), K. Nagaoka1)3), M. Osakabe1)2), S. Kamio1), Y. Fujiwara1), Y. Haba3), and Y. Takeiri1)2)

National Institute for Fusion Science, National Institutes of Natural SciencesSOKENDAI, (The Graduate University for Advanced Studies)Graduate School of Science, Nagoya University

Slide2

Contents

Introduction of Neutral beam injector (NBI) for the Large Helical Device (LHD), and schedule of first Deuterium experiments.Result of total beam injection power in 2017 Deuterium operation on a positive ion based NBI (P-NBI)Deuterium operation on a negative ion based NBI (N-NBI)Summary2/17

Slide3

Neutral Beam Injectors for LHD

Tangential Injection

Radial Injection

Top viewing

BL1 1998–

BL2 1998–

BL3 2001–

BL4 2005–

BL5 2010–

(for D)

P-NBI

Upgrade beam energy

40

keV

60

keV

(BL4)

40

keV

80

keV

(BL5)

(Optimized for D)

9 MW/BL

for D operation

N-NBI

No energy increase 180 keV (BL1, BL2, BL3)

(Optimized for H)

5 MW/BL for H operation

6MW/BL

(H)→

~3.5 MW/BL for D operation

(Expectation)

2x

3x

3

/17

Slide4

D

NBI operation in 2017 LHD campaignFebMar

Apr

May

Jun

Jul

Aug

Jan

Full D-D

Mix D-H

Full H

D-H

Full H

P-NBI

N-NBI

LHD Experiment

26 weeks

29 weeks

D

beam operation

H

beam operation

H

beam operation

Only changing operation gas

Y2017

Start Deuterium experiment used high power

deuterium beam

Both H and D beams are injected into LHD

Neutron

bu

dget

Learning deuterium operation

H

H

4

/17

Slide5

Result of NB Power in 2017

Total injection powerWe provided totally 31MW beam power into LHD plasma during mixed D-H phase (D-beam from P-NBI and H-beam from N-NBI)>18MW

>15MW(for D)

P-NBI

•Upgrade beam energy

40keV

60

keV

(BL4)

40keV

80

keV

(BL5)

(Optimized for D)

9MW/BL

for D operation

N-NBI

•Without increase beam energy

180keV (BL1, BL2, BL3)

(Optimized for H)

5MW/BL

for H operation

31MW

6MW/BL

(H)→Update our new record(D+H beam)5/17

Slide6

Deuterium operation on P-NBIs

6/17

Slide7

Injection beam power by P-NBI

HGap distanceEnergyInjection powerBL45 mm45 keV6.5 MWBL55mm44 keV6.1 MW

DGap distanceEnergyInjection power

BL4

8

mm

60

keV

9.4 MW

BL5

9 mm

75

keV

10.6 MW

Y2015 Hydrogen operation

Y2017 Deuterium operation

P-NBI

7

/17

Slide8

Beam & source characteristics on D

Good beam quality of high Deuteron ratio (83%) same as hydrogen discharge Small optimum perveance with same arc efficiency for beam current .Good beam divergence on DNarrow beam width on D

Concentration of heating power at plasma center

Power ratio

Mainly heated by

full energy component

8

/17

Slide9

Deuterium operation on N-NBI

9/17

Slide10

First trial of D-operation in N-NBI

Change operation gas• Replacement of discharge gas from H to D by evacuating residual gas into a pipe and buffer tank.• Start 0.3 Pa D2 source gas pressure.• Low D– current and

high electron current ratio at the beginning.• That is recovered by Cs conditioning D- ⇒ 40 A  Ie/ID- ⇒

0.55

Necessary optimization for D

Increasing Cs signals

High sputtering

Change surface condition

High Cs consumption

(

I

ex

I

acc) ≈ electron current

Iacc ≈ negative ion current

10

/17

-

-

Slide11

Pressure dependence

High gas pressure assists D operation Low gas pressure can be used in H–≈ e/D

Checking extracted current by operation gas pressure in low arc discharge power

D

e

~ 0.3 Pa

~ 0.43 Pa

Keeping low electron

current ratio in

wide range

e/D

slightly increase in low pressure region

e/H

e

H

11

/17

-

-

-

-

Slide12

Bias voltage dependence

Large increase of electron in low bias in DNegative ion current is also suppressed by high biasHigh bias effectively decrease e/D–

Keeping low e/H

~0.2 in low bias

e/D

D

e

Bias

voltage

plays

a role of suppressing the entry of electrons into the beam

3 V bias on PG

5.6 V bias on PG

e/H

e

H

12

/17

-

-

-

-

Slide13

A

rc efficiency on N-NB source• Conservative beam operation have been done for safety reasons in this campaign.• Result of beam current for H and D during beam injection as the function of Parc .

BL3Parc

: Total arc discharge power used two source

• Beam current linearly increases by arc discharge power. (No saturation in D)

• Deuterium beam current is

66%

of hydrogen beam current (

averaged value

), which

reachs

to

190A/m

2

.

13

/17

x0.66

Slide14

Lower limit for electron current ratio

(Iex – Iacc) ≈ electron current

Iacc ≈ negative ion currentBL3

e/D

-

e/H

-

Lower limit for co-extracted electron current ratio

as the function of

P

arc

clearly change

in D operation.

e/H

<0.3

in high power operation in H.

e/D

– increased 0.38

at 370 kW arc discharge.

(e/I

acc)/100kW

9 %/100kW (D)

1.4 %/100kW (H)

Slope

electron current limits beam power• Input discharge power strongly affects to electron current ratio in D operation. Its may due to an increase of momentum flux. 14

/17

Slide15

Injection beam power by N-NBI

HIe/IH-EnergyInj. powerBL10.27190 keV 5.6 MWBL20.30178 keV

4.6 MWBL30.23185 keV4.8 MW

Y2017 hydrogen operation

Y2017 Deuterium operation

N-NBI

D

I

e

/I

D

-

Energy

Inj. power

BL1

0.49

190

keV

2.1 MW

BL2

0.54

171

keV

1.9 MW

BL3

0.39

178

keV

2.3 MW

Negative ion source is

optimized for H

operation

(only Gas change)HD

Totally 15 MW (H)

Totally 6.3

MW (D)

Conservative beam operation in D

15/17

Slide16

Summary (1)

First Deuterium beam injection have been done safely in five beam lines in LHD Total injection beam power up to 31 MW. [P-NBI(D)/N-NBI(H)]10.6 MW (75 keV) deuterium beam with shape width and 83% deuteron ratio has achieved on P-NBI by upgraded beam energy and optimizing electrode gap distance. Negative ion current for D is 66% of H, that is reached 190 A/m2. Injection beam power is less than half with conservative beam operation. 16/17

Slide17

Summary (2)

In the D- beam, lower limit of the electron current ratio strongly depends on Parc .This result suggests that deuterium momentum flux strongly influences to the surface condition and the production rate of deuterium negative ions. Improvement of deuterium negative ion and additional electron suppression method will be required for high power deuterium beam injection.

17/17Thank you for your attention !