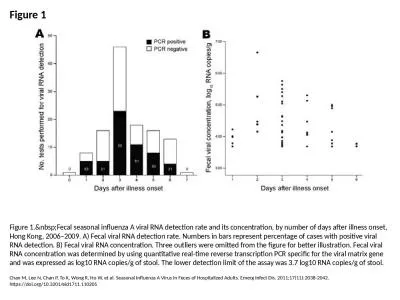
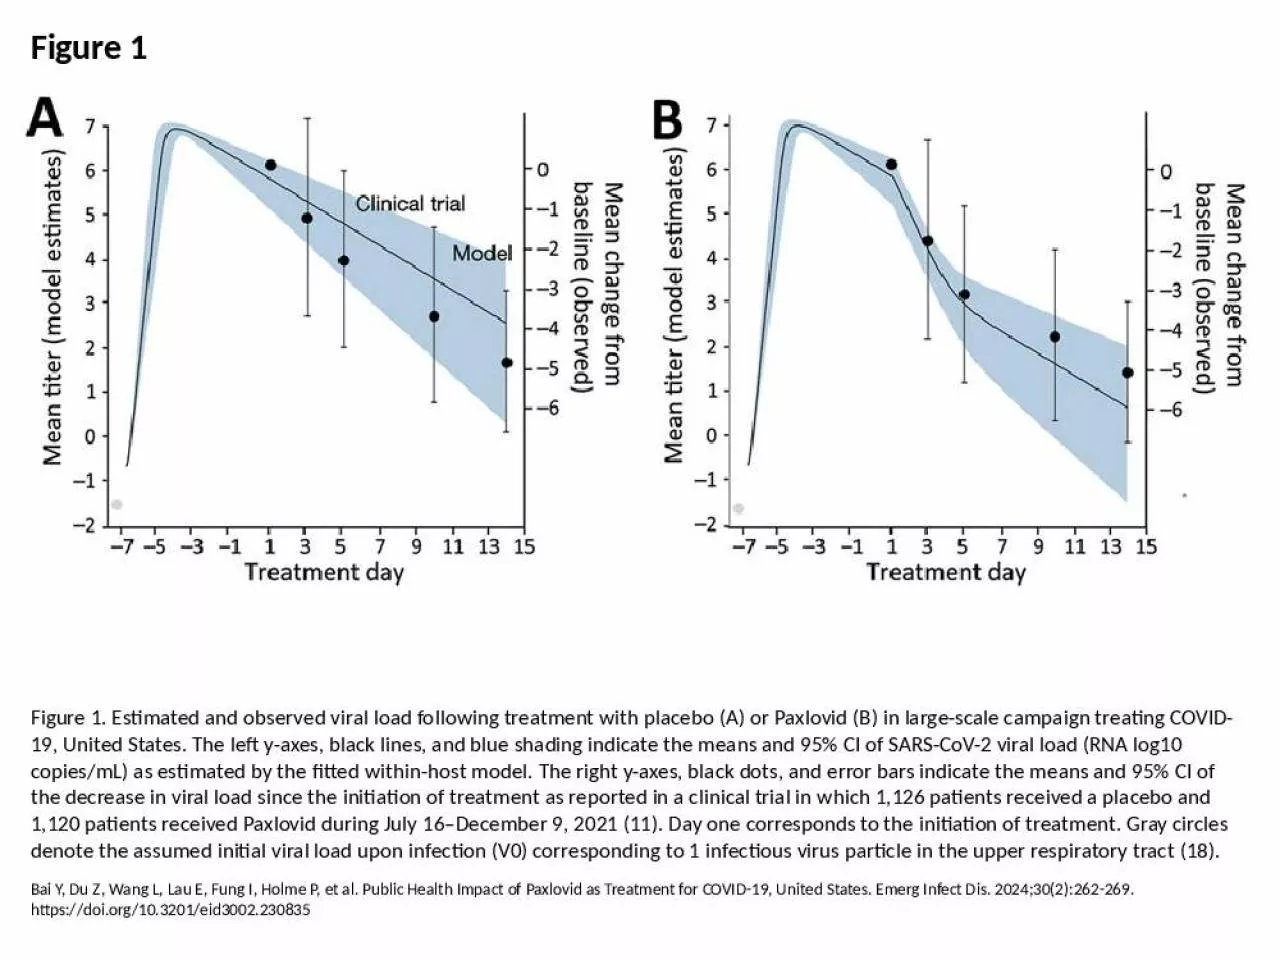
PPT-Figure 1 Figure 1. Estimated and observed viral load following treatment with placebo

Author : gian | Published Date : 2024-10-04

Bai Y Du Z Wang L Lau E Fung I Holme P et al Public Health Impact of Paxlovid as Treatment for COVID19 United States Emerg Infect Dis 2024302262269 httpsdoiorg103201eid3002230835

Presentation Embed Code

Download Presentation

Download Presentation The PPT/PDF document "Figure 1 Figure 1. Estimated and observe..." is the property of its rightful owner. Permission is granted to download and print the materials on this website for personal, non-commercial use only, and to display it on your personal computer provided you do not modify the materials and that you retain all copyright notices contained in the materials. By downloading content from our website, you accept the terms of this agreement.

Figure 1 Figure 1. Estimated and observed viral load following treatment with placebo: Transcript


Bai Y Du Z Wang L Lau E Fung I Holme P et al Public Health Impact of Paxlovid as Treatment for COVID19 United States Emerg Infect Dis 2024302262269 httpsdoiorg103201eid3002230835. -1- Figure 1 -2- Figure 3 Figure 4 Figure 5loss resistance is zero, and that the radiation resistance is the textbook figure of 35 ohms. The feedpointimpedance would then be 15+0+35 = 50 ohms, and th Schematic. of . picornavirus. . genome. . organization. . The positive-. strand. RNA has the viral . protein. . VPg. . covalently. . linked. to the 5′ end of the . genome. . . Both. the 5′ and 3′ . Evidence from modelling and economic analysis. Operationalising 90:90:90 from inputs to outputs. Rainbow Towers Conference Centre, Harare, Zimbabwe. 2 December 2015. Andrew Phillips, . Paul Revill. , Tim . Head of Statistics for Internal Medicine RU . Early Clinical Devel. opment. Pfizer. Is High Placebo Response Really a Problem in Clinical Trials?. The Placebo Response “Problem”. Typical response to a failed drug trial “The study failed due to an unexpectedly high placebo response……”. Beck, M.B. (1982) Time-Series Analysis of Nutrient Loadings in the Zala River, Lake Balaton. IIASA Working Paper. IIASA, Laxenburg, Austria, WP-82-116 Copyright 1982 by the author(s). http://pure.ii My Personal Path to Treatment. Treatment . Literacy. My Personal Path. In this activity: . You will illustrate on a flip chart, your personal HIV history from when you were diagnosed to now, and reflect on critical steps in your journey.. 3043-02 904 Caribbean Drive Sunnyvale, CA 94089 USA TOLL FREE +1.888.336.2743 PHONE +1.408.541.4191 FAX +1.408.541.4192 EUROPEAN HEADQUARTERS Vira Solelh 81470 Maurens-Scopont France PHONE FAX Duh D, Saksida A, Petrovec M, Ahmeti S, Dedushaj I, Panning M, et al. Viral Load as Predictor of Crimean-Congo Hemorrhagic Fever Outcome. Emerg Infect Dis. 2007;13(11):1769-1772. https://doi.org/10.3201/eid1311.070222. Chan M, Lee N, Chan P, To K, Wong R, Ho W, et al. Seasonal Influenza A Virus in Feces of Hospitalized Adults. Emerg Infect Dis. 2011;17(11):2038-2042. https://doi.org/10.3201/eid1711.110205. Early Clinical Devel. opment. Pfizer. Is High Placebo Response Really a Problem in Clinical Trials?. The Placebo Response “Problem”. Typical response to a failed drug trial “The study failed due to an unexpectedly high placebo response……”. Consort flow chart summarizing the number of patients screened, enrolled, treated and followed on the study. *one patient was re-assessed for eligibility at recurrence and re-enrolled on the study. Created with BioRender.com.. Kirschner DE, Webb G. Resistance, Remission, and Qualitative Differences in HIV Chemotherapy. Emerg Infect Dis. 1997;3(3):273-283. https://doi.org/10.3201/eid0303.970303. Albariño CG, Foltzer M, Towner JS, Rowe LA, Campbell S, Jaramillo CM, et al. Novel Paramyxovirus Associated with Severe Acute Febrile Disease, South Sudan and Uganda, 2012. Emerg Infect Dis. 2014;20(2):211-216. https://doi.org/10.3201/eid2002.131620. Learning Objectives. Understand the dynamics of viral load during the course of HIV infection. Understand how viral load affects risk for transmission and progression of HIV. Explain how viral load responds to antiretroviral therapy (ART).

Download Document

Here is the link to download the presentation.
"Figure 1 Figure 1. Estimated and observed viral load following treatment with placebo"The content belongs to its owner. You may download and print it for personal use, without modification, and keep all copyright notices. By downloading, you agree to these terms.

Related Documents