/
A brief introduction to the A brief introduction to the

A brief introduction to the - PowerPoint Presentation

giovanna-bartolotta
giovanna-bartolotta . @giovanna-bartolotta
Follow
376 views
Uploaded On 2018-03-21

A brief introduction to the - PPT Presentation

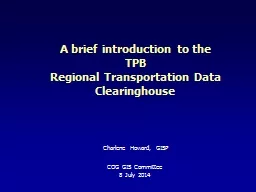
TPB Regional Transportation Data Clearinghouse Charlene Howard GISP COG GIS Committee 8 July 2014 Presentation outline W hat is the Clearinghouse RTDC Main components of the Clearinghouse ID: 659371

rtdc data counts amp data rtdc amp counts 2012 related count classification traffic regional passenger vehicle metrorail survey layers

Share:

Link:

Embed:

Download Presentation from below link

Download Presentation The PPT/PDF document "A brief introduction to the" is the property of its rightful owner. Permission is granted to download and print the materials on this web site for personal, non-commercial use only, and to display it on your personal computer provided you do not modify the materials and that you retain all copyright notices contained in the materials. By downloading content from our website, you accept the terms of this agreement.


Presentation Transcript

Slide1

A brief introduction to the TPBRegional Transportation Data ClearinghouseCharlene Howard, GISP

COG GIS Committee

8 July 2014Slide2

Presentation outlineWhat is the Clearinghouse (RTDC)?Main components of the ClearinghouseRecent functional enhancementsHighlights: selected data layers (new and updated)

Annualized/Hourly Traffic

Volumes

Vehicle Classification

INRIX data

Average Weekday Transit Ridership

Central Employment Core Cordon Count

WMATA: Metrorail Passenger Survey & other data

Demonstration of the RTDC

Looking aheadSlide3

What is the RTDC?Overall, it is a collection of transportation-related dataIncludes our own datasets & data collected from member agencies & assembled by usAdditional Esri base maps for referenceRTDC first released over a decade ago as an ArcView 3.2 project

Over the years, focus has shifted toward building a comprehensive regional database of traffic counts tied to the TPB master network

Expanded to include transit-related count data & other datasets

Currently available as a

desktop

web

map application using the ArcGIS Viewer for Flex (version 3.6)

Member jurisdiction and agency staff needed an easier way to access our datasets than what has traditionally been delivered to them

Provides users with a more interactive experienceSlide4

What is the RTDC? continued

A web-based transportation data viewerSlide5

Main components of the RTDCWidgets- the tools that provide application functionalityThe RTDC includes both OOTB and custom 3rd party widgetsEmphasis on trying to be as OOTB as possible

Advanced Query- show

related

data

tables

*

Query (‘select by attribute

’)

*

Download Data

Documents (User’s Guide)

Cordon Count resourcesWMATA datasetsBike Data General application & navigation

Available data layers

Highway network (traffic related)

Annualized Annual Volumes

Hourly Traffic

Counts

Classification

Counts

Transit Routes- Average

Ridership

Central Employment Core Cordon Count

2011 Regional Air Passenger Survey

2012 Metrorail Passenger Survey

Metrorail Stations & Lines

Cooperative

Forecast by TAZ

Version 2.3

Screenlines, Regional Core

2013 Regional Activity Centers

Regional

Boundaries

Bike: jurisdictional & Capital

Bikeshare

Slide6

Data enhancements to the RTDCUpdates to current data layersHourly Traffic CountsAnnualized Traffic Volumes

Average Weekday Transit Ridership

Regional Activity Centers

Cooperative Forecast

Metrorail: stations & lines

New data layers added to the RTDC

External Station Traffic Volumes

2012 Vehicle Classification Counts

Central Employment Core Cordon Count

Vehicle Counts by Mode

HOV/SOV Counts

Passenger Counts by Mode

2011 Regional Air Passenger Survey

Regional Core area polygon

** Data obtained from partners**

- WMATA datasets

- Bicycle-related data

** Coming soon

**

Aggregated

INRIX speed data Slide7

Recent functional enhancements

Related records

Ability

to view related records in the popup menus & attribute table

window

3

rd

party widgets allow export of related tables (OOTB does not)

Hourly & Classification Counts, Cooperative Forecast, Metrorail Passenger Survey

Using GDB attachments

PDF

reports highlighting selected data for select RTDC data

layers

Reports created in Excel; converted to PDF

2012 Metrorail Passenger

Survey; Central

Employment Core Cordon Count Data Layer tools- a different way to view dataSpecialized ‘tools’ for interacting with certain RTDC data layersQuery & Layer List widgets used as menu items

A simple way to

highlight data without creating custom toolsSlide8

Annualized & Hourly Traffic VolumesUpdated station to link matching for split links

Updated

Annualized Traffic Volumes layer to include

2006-2012

data

Updated Hourly Traffic Counts layer to include

2008-

2012

data

Added AADT and AAWDT for 2010-2012 at External Stations

Annual Volumes for links and External Stations

updated & new to the RTDCSlide9

2012 Vehicle Classification CountsPie charts showing time-of day vehicle classification

Pop-up hourly vehicle classification values

Query of vehicle classification data

(coming soon)

File download of hourly 2012 state vehicle classification data with related network link

(coming soon)

2012 Vehicle Classification related to network links

New to the RTDCSlide10

Coming Soon – INRIX DataAggregated Freeway and Arterial corridors

Speed Data aggregation

30 minute intervals non-holiday

Tu

/We/

Th

60

minute intervals

weekends

By month

2010 -2012

INRIX Speed Data – Aggregated temporally and spatially

New to the RTDCSlide11

New & existing transit ridership data joined to the 2013 year TPB regional transit network.Average weekday ridership by month for FY13New data fields for provider route name & notes

Continuing to expand data collection, added Loudoun County Local Bus

Average Weekday Transit

R

idership

UpdatedSlide12

Layers displayed by data typeVehicle Counts by Transportation ModeHOV/SOV CountsPassenger Counts by Transportation Mode

The CECC Data Layer

tool

displays stations with bike counts, new and changed count stations, and Station Count reports.

Station Count Report

HOV & SOV Comparison Chart

Data Layer Tool

Central Employment Core Cordon Count

New to the RTDC

CECC Station locations containing AM peak period data for years ‘93,’96, ‘99, ‘02, ‘06, and ‘13 Slide13

Metrorail Survey & Other DataDatasets were obtained from WMATA to be used in the RTDC and are

accessible through a custom Data Layer t

ool

Average weekday passenger

boardings

by y

ear

Station Amenities-

Parking spaces, bike rack spaces, and bike locker spaces

2012 Metrorail Passenger

Survey Weekday Results Household income, race,

mode of access, trip

purpose, origination and

destination stations

Summary report for each station (PDF)

New to the RTDCSlide14

Demonstration

https://gis.mwcog.org/webmaps/RTDCSlide15

Shorter termInclusion of ‘coming soon’ data layersAggregated INRIX speed dataClassification counts – Query & data download

RTDC efforts will go into ‘maintenance mode’ to address any data inconsistencies, application bugs, etc.

Acquire additional bicycle data

layers

Integrate user suggestions

Longer term

Data: additional datasets- what can we add to the RTDC?

Data: update

RTDC layers on an ‘as-available’ basis

Application: additional ways to access / view data

Application: ArcGIS Online maps of RTDC datasets

Your

suggestions for data & application enhancements are appreciated & encouraged!

Looking aheadSlide16

The RTDC teamJohn KentMartha KileNicole McCall

Jessica Mirr

Charlene HowardSlide17

For more questions, please contact Charlene HowardPrincipal GIS Analyst

202/ 962.3384

charlene@mwcog.org

https://

gis.mwcog.org/webmaps/rtdc