PPT-Introduction to Graphs
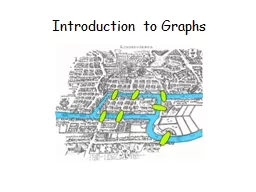
This Lecture In this part we will study some basic graph theory Graph is a useful concept to model many problems in computer science Seven bridges of Konigsberg
Download Presentation
"Introduction to Graphs" is the property of its rightful owner. Permission is granted to download and print materials on this website for personal, non-commercial use only, provided you retain all copyright notices. By downloading content from our website, you accept the terms of this agreement.
Presentation Transcript
Transcript not available.