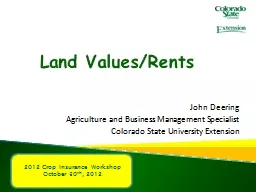
Agriculture and Business Management Specialist Colorado State University Extension 2012 Crop Insurance Workshop October 30 th 2012 Average Farm Real Estate Values Source USDA National Agricultural Statistics Service ID: 634559
Download Presentation The PPT/PDF document "Land Values/Rents John Deering" is the property of its rightful owner. Permission is granted to download and print the materials on this web site for personal, non-commercial use only, and to display it on your personal computer provided you do not modify the materials and that you retain all copyright notices contained in the materials. By downloading content from our website, you accept the terms of this agreement.
Slide1
Land Values/Rents
John DeeringAgriculture and Business Management SpecialistColorado State University Extension
2012 Crop Insurance Workshop
October 30
th
, 2012Slide2
Average Farm Real Estate Values
Source: USDA, National Agricultural Statistics Service
Inflation adjusted using GDP Chain-type deflator, 2005 = 100Slide3
Why are outside investors interested?
Source: USDA, National Agricultural Statistics Service, St. Louis Federal ReserveAAA = Moody’s Seasoned AA Corporate Bond Yield, 10-Year Treasury Constant MaturitySlide4
Other influences on land valuesRecent high net returns from farming
Low interest rates1031 ExchangesPension fundsNeighborsSlide5
Farm real estate and net cash income, 1990-2011
Real estate values are inflation
adjusted to 2005 by
the GDP
Chain-type deflatorSource: USDA, National Agricultural Statistics Service, Economic Research ServiceSlide6
Farm real estate and net cash income, 1990-2011
Real estate values are inflation
adjusted to 2005 by
the GDP
Chain-type deflatorSource: USDA, National Agricultural Statistics Service, Economic Research ServiceSlide7
Farm real estate & 3 month Treasury
Real estate values are inflation adjusted to 2005 by
the GDP
Chain-type deflator
Source: USDA, Economic Research Service, St. Louis Federal ReserveSlide8
Value of Non-Irrigated CroplandSecond Quarter 2012Slide9
Farmland Values - Annual % Changes
Source: Federal Reserve Bank of Kansas CityTenth Federal Reserve District (Quarterly Agricultural Credit Survey) CO, KS, NE, OK, WY (NM, MO)
2
nd
Quarter percentage changes from 1 year prior 2007 12.5% 2008 18.3% 2009 0.4% 2010 4.8% 2011 21.3% 2012 26.4%Slide10
Farmland Values - Annual % Changes
Source: Federal Reserve Bank of Kansas CityTenth Federal Reserve District (Quarterly Agricultural Credit Survey)CO, KS, NE, OK, WY (NM, MO)
2
nd
Quarter percentage changes from 1 year prior $1,000 in 2006 2007 12.5% 2008 18.3% 2009 0.4% 2010 4.8% 2011 21.3% 2012 26.4% $2,147 in 2012Slide11
Alternative Investments
Source: Woulda coulda shoulda
Year Farmland S&P 500 Apple Inc.
(Adjusted)2006 $1,000 $1,000 $1,000 2012 $2,147 $1,237 $9,898 Slide12
Rent-to-value ratio
Source: USDA, National Agricultural Statistics ServiceSlide13
Rent-to-value % in nearby states
Source: Kansas State University Department of Agricultural Economics (Publication: AM-KCD-2011.18)After Property Tax Ag Rents as % of Value
1951-2010 2011
CO 5.65% 2.37%
KS 5.81% 3.24 %NE 6.42 % 4.20 %OK 4.46 % 2.21 %WY 6.16 % 1.49 %Slide14
Determining equitable lease rates
Percentage of land valueLately a volatile propositionFixed cash rent
Shifts risk to tenant, easier for absentee landlords
Crop share rent
Increasingly hard on tenants with changes in technology & higher input costsFixed cash rent floor with “bonus” tied to price & yieldAllows landlord to participate in some upside & lowers downside risk for tenantSlide15
CSU ABM Lease Templates &Enterprise Budgets
Crop Share Lease AgreementsFixed Cash Crop Lease AgreementsFlexible Cash Crop Lease AgreementsLeasing Arrangements for CattlePasture LeasesEstimating Rental Rates of Crop Land for Landowners & Tenants (Excel Workbook)
CSU Crop Enterprise Budgets (Corn, Alfalfa, Wheat, Sunflowers,
Sugarbeets
, Millet, Pinto Beans, etc.)http://www.coopext.colostate.edu/ABM/cropbudgets.htmSlide16
CSU ABM Excel Template
Estimating Rental Rates of Crop Land
for Landowners and Tenants
By:
Jeffrey E. Tranel
Norman Dalsted, PhD
Agriculture and Business Management Economists
Colorado State University
http://www.coopext.colostate.edu/ABM
/
Email your questions to: jtranel@colostate.edu
This template is designed to help landowners and tenants of crop land compare the portions of production and expenses.
You may move to each tab (at the bottom of the screen).
Enter your data into any cell with a pale background and blue colored numbers.
Programs are available to all without
discrimination
.Slide17
Estimating Rental RatesSlide18
Estimating Rental RatesSlide19
Land value & rent data resources
County assessor offices & webpages (Sale data)http://www.qpublic.net/co/Alamosa, Cheyenne, Conejos, Crowley, Custer, Dolores, Fremont, Gunnison, Kit Carson, Las Animas, Lincoln, Mineral, Saguache, San Juan, Sedgwick, Washington, YumaUSDA/NASS Surveys (Rent survey, county level)CSU ABM Custom Rates Survey (Rent survey, region)
http://www.coopext.colostate.edu/ABM/custrates.htmSlide20
SourcesNickerson, C., M. Morehart, T. Kuethe, J. Beckman, J. Ifft, and R. Williams (2012) “Trends in U.S. Farmland Values and Ownership”
EIB 92 Economic Research ServiceKansas State University Department of Agricultural Economics (Publication: AM-KCD-2011.18)Federal Reserve Bank of Kansas City – Tenth Federal Reserve District (Quarterly Agricultural Credit Survey)Slide21
Questions?
John Deering
970-345-2287
john.deering@colostate.edu
Lease Arrangement Resources:http://www.coopext.colostate.edu/ABM/investment.htm