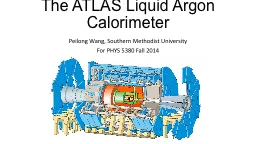
micromegas Work in progress 09082011 J Wotschack 1 The issue The measurement of the background rate in the ATLAS cavern using the micromegas detectors was suggested by L Pontecorvo ID: 460635
Download Presentation The PPT/PDF document "Measurement of background rate in ATLAS ..." is the property of its rightful owner. Permission is granted to download and print the materials on this web site for personal, non-commercial use only, and to display it on your personal computer provided you do not modify the materials and that you retain all copyright notices contained in the materials. By downloading content from our website, you accept the terms of this agreement.
Slide1
Measurement of background rate in ATLAS cavern with micromegas
Work in progress
09/08/2011
J. Wotschack
1Slide2
The issue
The measurement of the background rate in the ATLAS cavern, using the micromegas
detectors, was suggested by L. Pontecorvo
The idea is to compare the measured rates with the predictions and the measured background rates in the corresponding MDTs
Expected and measured (by MDT) rates are ≈10 Hz/cm
2
09/08/2011
J. Wotschack
2Slide3
Measured rate in Hz/cm2 in the MDT
09/08/2011
J. Wotschack
3
EOL2/3 data from run 180400
<L> = 5.5 10
32
MMs
Plot kindly made available by Geraldine ContiSlide4
The setup
Since beginning of 2011 four small (9 x 9 cm
2 active area) micromegas detectors are installed on the HO structure, 6
th floor, side A
The setup is located 1.5 m behind EOL2A7, in the range of the outer 15 tubes and close to EOS2A6
Two detectors (R11 and R12) are used as trigger and two detectors (R13 and R16) are read out
R13 and R16 have readout strips with a pitch of 0.25 mm, R13 has 360 vertical (x) strips, R16 has 360 vertical (x) and 360 horizontal (y) strips
The setup is operated stand-alone and has recorded so far several 10k events
09/08/2011
J. Wotschack
4Slide5
Cavern background measurement
We recorded events taken with a random trigger, with a rate of 156 Hz, during
Fill 2000 and 2009, for about 20 hours and 11 hours
Total number of triggers: 11.4 M + 6.2 MFor each trigger the detector activity was measured for 28 time bins of 25 ns, i.e. 700
ns.
Events were accepted in a time window from 5 to 25 time bins, i.e. over 500 ns.
Total time covered: ≈6 s, total area: 2 x 81 cm
2
09/08/2011
J. Wotschack
5Slide6
Event characteristics
475 + 312 events with more than 150 ADC counts in a single strip were recorded
In 5 +13 events some activity, arriving at the same time, was recorded in R13 and R16; these events have been removed, They are likely to have come from an interaction.
323 + 172 triggers were retained with activity in the detector in the time window between 5 and 25 time bins of 25 ns
149 + 84 events were recorded in R13 and 175 + 88 in R16
Comparing to events from interactions, a few % of the events may be lost by requiring a strip signal >150 ADC counts
09/08/2011
J. Wotschack
6Slide7
Two types of typical events
Photon ?
Neutron ? induced nuclear break-up
Total charge: 1700 ADC counts
Total charge: >10000 ADC counts
09/08/2011
J. Wotschack
7Slide8
The result: R≈2.7±0.2 Hz/
cm2 at L=1034
09/08/2011
J. Wotschack
8Slide9
Conclusions
Background events have been recorded with a random trigger in R13 and R16 for several long LHC fills
We observe two types of events: photon-like and neutron-like
We see a background rate consistent between runs and the two chambers of ≈2.7 Hz/cm2
The observed rate is about a factor 3 lower than what is seen in the nearby
EOL2 MDT chambers
09/08/2011
J. Wotschack
9