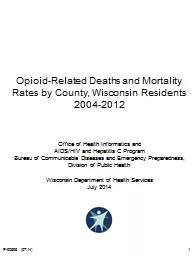
20042012 Office of Health Informatics and AIDSHIV and Hepatitis C Program Bureau of Communicable Diseases and Emergency Preparedness Division of Public Health Wisconsin Department of Health Services ID: 682381
Download Presentation The PPT/PDF document "Opioid-Related Deaths and Mortality Rate..." is the property of its rightful owner. Permission is granted to download and print the materials on this web site for personal, non-commercial use only, and to display it on your personal computer provided you do not modify the materials and that you retain all copyright notices contained in the materials. By downloading content from our website, you accept the terms of this agreement.
Slide1
Opioid-Related Deaths and Mortality Rates by County, Wisconsin Residents2004-2012Office of Health Informatics andAIDS/HIV and Hepatitis C ProgramBureau of Communicable Diseases and Emergency Preparedness,Division of Public HealthWisconsin Department of Health ServicesJuly 2014
1
P-00696 (07/14)Slide2
MethodsAll opioid-related deaths:Case finding using specifications from MMWR, Vol. 62, No. 26, 7/5/2013Any contributing cause of death T401-T404, International Classification of Diseases, 10th editionIncludes heroin, methadone and all other natural and synthetic opioids
Wisconsin resident death certificates and county population
estimates, 2004-2012, from Wisconsin Department of Health Services, Division of Public Health, Office of Health Informatics
Levels
of urbanization
from 2006 National Center for Health Statistics (NCHS) Urban-Rural Classification Scheme
2Slide3
Opioid-related deaths, by county, Wisconsin residents2004Source: Wisconsin resident death certificates; Department of Health Services, Division of Public Health, Office of Health Informatics.
3Slide4
Source: Wisconsin resident death certificates; Department of Health Services, Division of Public Health, Office of Health Informatics.Opioid-related deaths, by county, Wisconsin residents
20054Slide5
Source: Wisconsin resident death certificates; Department of Health Services, Division of Public Health, Office of Health Informatics.Opioid-related deaths, by county, Wisconsin residents
20065Slide6
Source: Wisconsin resident death certificates; Department of Health Services, Division of Public Health, Office of Health Informatics.Opioid-related deaths, by county, Wisconsin residents
20076Slide7
Source: Wisconsin resident death certificates; Department of Health Services, Division of Public Health, Office of Health Informatics.Opioid-related deaths, by county, Wisconsin residents
20087Slide8
Source: Wisconsin resident death certificates; Department of Health Services, Division of Public Health, Office of Health Informatics.Opioid-related deaths, by county, Wisconsin residents
20098Slide9
Source: Wisconsin resident death certificates; Department of Health Services, Division of Public Health, Office of Health Informatics.Opioid-related deaths, by county, Wisconsin residents
20109Slide10
Source: Wisconsin resident death certificates; Department of Health Services, Division of Public Health, Office of Health Informatics.Opioid-related deaths, by county, Wisconsin residents
201110Slide11
Source: Wisconsin resident death certificates; Department of Health Services, Division of Public Health, Office of Health Informatics.Opioid-related deaths, by county, Wisconsin residents
201211Slide12
Counties with no opioid-related deaths, Wisconsin, 2004-2012Source: Wisconsin resident death certificates; Department of Health Services, Division of Public Health, Office of Health Informatics.Wisconsin Counties with No Opioid Deaths12Slide13
Counties by level of urbanization, Wisconsin, 2010
Source: American Community Survey,
2010.13Slide14
Opioid-related mortality rates per 100,000 population, by level of urbanization, Wisconsin, 2004-2012Mortality rate per 100,000 populationSource: Wisconsin resident death certificates; Department of Health Services, Division of Public Health, Office of Health Informatics.Milwaukee CountyStatewide
Smaller metroNon-metro
14Slide15
Heroin-related mortality rates per 100,000 population, by level of urbanization, Wisconsin, 2004-2012Mortality rate per 100,000 populationMilwaukee CountyStatewideNon-metro
Smaller metroSource: Wisconsin resident death certificates; Department of Health Services, Division of Public Health, Office of Health Informatics.
15Slide16
Opioid-related mortality rates, by county, Wisconsin residents2004-2006*Source: Wisconsin resident death certificates; Department of Health Services, Division of Public Health, Office of Health Informatics.* Annual average rate per 100,000 population** Rates not shown if 1-4 deaths over the three-year period
16Slide17
Opioid-related mortality rates, by county, Wisconsin residents2007-2009*Source: Wisconsin resident death certificates; Department of Health Services, Division of Public Health, Office of Health Informatics.* Annual average rate per 100,000 population** Rates not shown if 1-4 deaths over the three-year period
17Slide18
Opioid-related mortality rates, by county, Wisconsin residents2010-2012*Source: Wisconsin resident death certificates; Department of Health Services, Division of Public Health, Office of Health Informatics.* Annual average rate per 100,000 population** Rates not shown if 1-4 deaths over the three-year period
18Slide19
Key PointsOpioid-related deaths and mortality rates increased in Wisconsin between 2004 and 2012.The number of Wisconsin counties with no opioid-related deaths declined from 36 to 17 between 2004 and 2012.The rate of
increase in opioid-related mortality rates during 2004-2012 was similar statewide, in Milwaukee County, and in smaller metropolitan and non-metro counties.
Heroin-related deaths accounted for about one-third of all opioid-related
deaths between 2004 and 2012.
19