/
 Sounds in a reverberant room can interfere with the direct sound source. The normal hearing  Sounds in a reverberant room can interfere with the direct sound source. The normal hearing

Sounds in a reverberant room can interfere with the direct sound source. The normal hearing - PowerPoint Presentation

giovanna-bartolotta
giovanna-bartolotta . @giovanna-bartolotta
Follow
344 views
Uploaded On 2020-04-02

Sounds in a reverberant room can interfere with the direct sound source. The normal hearing - PPT Presentation

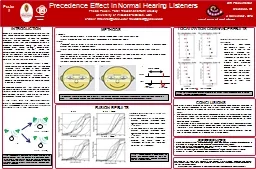
T his is called the precedence effect PE The precedence effect is a perceptual phenomenon where the cues of the preceding direct sound the lead dominate over laterarriving reflections the lag ID: 774676

listeners sound lead khz listeners sound lead khz effect lag lld stimuli precedence fusion noise hearing lateralization location perceived

Share:

Link:

Embed:

Download Presentation from below link

Download Presentation The PPT/PDF document " Sounds in a reverberant room can interf..." is the property of its rightful owner. Permission is granted to download and print the materials on this web site for personal, non-commercial use only, and to display it on your personal computer provided you do not modify the materials and that you retain all copyright notices contained in the materials. By downloading content from our website, you accept the terms of this agreement.


Presentation Transcript

Slide1

Sounds in a reverberant room can interfere with the direct sound source. The normal hearing (NH) auditory system has a mechanism by which the echoes, or reflections, can be minimized. This is called the precedence effect (PE). The precedence effect is a perceptual phenomenon where the cues of the preceding direct sound, the “lead,” dominate over later-arriving reflections, the “lag.” Varying the temporal delay between the lead and lag determines the PE. Furthermore, it has been primarily studied in NH listeners using pure tones or broadband stimuli. There are two key features of the PE: Fusion: At short lead-lag delays (LLDs), a single sound source can be perceived (Fig. 1c). The echo threshold (ET) is the delay at which two sound sources are perceived (Fig. 1b). NH ETs are in the range of 5-10 ms (Litovsky et al., 1999).Lateralization/Localization Dominance: Short LLDs allow the percept of the leading sound to dominate the overall perception of where the sound is located in space. The underlying mechanism that facilitates the PE is the binaural network in the brainstem that processes interaural timing differences (ITDs), or very short time delays between the ears, these are on the scale of microseconds (Brown and Stecker, 2013). In the current study, we manipulated lead-lag delays of narrowband noise bursts to assess the effect of frequency on the fusion and localization dominance in the PE over headphones.

While all

NH listeners exhibited PE similarly in the narrowband noise conditions according to two different frequencies (4 kHz and 10 kHz), these echo thresholds were slightly elevated in relation to previous PE literature (Litovsky et al., 1999; Brown and Stecker, 2013).The comparable effect seen across frequencies, in both the assessment of fusion and lateralization, shows that the PE has a strong presence across frequencies regarding a more complex signal; the use of narrowband stimuli may have contributed to these elevated echo thresholds. Furthermore, this data has implications for cochlear implant listeners because information is processed in these listeners through electrodes that have narrow frequency bands, therefore it may be possible to observe the PE in this population as well. Future studies will test cochlear implant listeners with this paradigm to explore if they are able to perceive sounds of a lead-lag pair at varying delays.

Subjects:6 normal hearing listeners; 3 male and 3 female ranging ages from 20-36 years old. Stimuli presented over ER2 ear-insert headphones in a soundproof booth.Stimuli:“Lead-lag” pairs of either a 10 kHz or 4 kHz narrowband noise burst, presented in separate blocks; a low-pass noise masker was present in additional blocks.Stimuli were played at opposing timing differences of -500 µs and +500 µs with LLDs varied from 1-64 ms.Task:Simultaneous fusion (hearing one vs. two locations) and lateralization (indicating location of fused image in upper panel, or location of left-most of two images in lower panel) task.Participants were asked to touch on the screen to indicate where they heard the sound.Listeners completed 350 trials (50 trials at each LLD).

METHODS

Poster #

Precedence Effect in Normal Hearing Listeners

Frieda Powell, Tanvi Thakkar, and Ruth LitovskyUniversity of Wisconsin-Madison, USAe-mail: tthakkar@wisc.edu; friedastarr@gmail.com

SRI PresentationMadison, WI 4 November , 2014

WAISMAN

CENTER

INTRODUCTION

Figure

3:

Average responses to whether one or two sounds were perceived (marked with points, with individual responses behind) depending on frequency and on presence of maskers

LOCALIZATION DOMINANCE RESULTS

Figure 4

: Points show average

lateralization

responses

for trials on

which subjects

reported one (black) or two (red)

sounds. Participants performed as expected.

CONCLUSIONS

Brown

AD,

Stecker

GC (2013). “The precedence effect: Fusion and lateralization measures for headphone stimuli lateralized by interaural time and level differences.” J Acoust Soc Am. 133(5):2883-98. Brown AD et al. (2013). “The Precedence Effect: Insights from electric hearing.” Presented at the 16th Conference on Implantable Auditory Prosthesis, Lake Tahoe, CALitovsky RY, Colburn HS, et al (1999). “The precedence effect.” J Acoust Soc Am. ;106(4 Pt 1):1633-54.Wallach et al. (1949). “The precedence effect in sound localization” Am J Psychol. 62(3):315-36.

REFERENCES

We would like to thank all our participants and Cochlear Ltd for providing equipment and technical assistance

. A special thank you to Shelly Godar for helpful comments and Andrew Brown for development of the software and program. NIH-NIDCD (R01 DC003083 to RYL), and NIH-NICHD (P30 HD03352 to Waisman Center).

ACKNOWLEDGEMENTS

Binaural Hearing and Speech Laboratory

FUSION RESULTS

Listeners

exhibited

the PE in all four conditions tested:

4 kHz noise bursts with and without masker: average thresholds were comparable across these conditions (~16

ms).10 kHz noise bursts with and without masker: average thresholds were comparable across these conditions (~16 ms).ETs for the different frequencies exhibited the same range of thresholds, illustrating that there was no effect of frequency.

4 kHz

4 kHz + Masker

10 kHz

10 kHz

+

Masker

Lateralization/Localization Dominance:

Localization dominance was generally

robust in both the 4 and 10 kHz conditions, meaning that there was also no effect of frequency in the location of the lead vs. the lag when listeners were presented opposing locations of a lead-lag pair.Two locations were always reported when the LLD was above or near the ET, and one location was always reported at short LLDs below the ET.

“One Location”

“Two Locations”

LLD = 1-64

ms

Left

Right

Lead,

+500

µ

s

ITD

Lag,

-500

µ

s

ITD

Figure 2:

a)

and

b)

Image of screen where listeners indicated whether they heard one or two locations and

where

the sound

was

heard. Listeners

were asked to judge the intracranial location and number of images heard on each trial. If two images were perceived, listeners were instructed to indicate the

left-most

image in the lower of 2 panels.

c) S

timuli presented to listeners; stimuli were single click pairs (lead and lag), played at opposing

ITDs

and varying lead-lag delays (1-64

ms

).

Figure 1

:

Perception of a direct sound and a reflection according to the delay between them; a) Illustrates he location of the direct sound in relation to the listener, b) when the

LLD

is greater than the ET (on average when the

LLD

is greater than 5-10

ms

), two sounds are perceived, c) when the

LLD

delay is below the ET (or less than 5-10

ms

), only the leading/ direct sound is perceived.

c.

b.

c.

a

.

b.

a

.

LLD

> 5-10

ms

LLD

< 5-10

ms