PDF-West Nile virus disease cases and deaths reported to CDC by year and c
Author : giovanna-bartolotta | Published Date : 2015-09-12
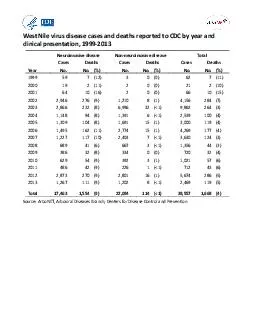
Neuroinvasive disease Non neuroinvasive disease Total Cases Deaths Cases Deaths Cases Deaths Year No No No No No No 1999 59 7 12 3 0 0 62 7 11 2000 19 2 11 2 0 0 21
Presentation Embed Code
Download Presentation
Download Presentation The PPT/PDF document "West Nile virus disease cases and deaths..." is the property of its rightful owner. Permission is granted to download and print the materials on this website for personal, non-commercial use only, and to display it on your personal computer provided you do not modify the materials and that you retain all copyright notices contained in the materials. By downloading content from our website, you accept the terms of this agreement.
West Nile virus disease cases and deaths reported to CDC by year and c: Transcript
Download Rules Of Document
"West Nile virus disease cases and deaths reported to CDC by year and c"The content belongs to its owner. You may download and print it for personal use, without modification, and keep all copyright notices. By downloading, you agree to these terms.
Related Documents