/
2/21/2013 2013 USGS NSHMP CA Workshop II 2/21/2013 2013 USGS NSHMP CA Workshop II

2/21/2013 2013 USGS NSHMP CA Workshop II - PowerPoint Presentation

gristlydell
gristlydell . @gristlydell
Follow
342 views
Uploaded On 2020-08-29

2/21/2013 2013 USGS NSHMP CA Workshop II - PPT Presentation

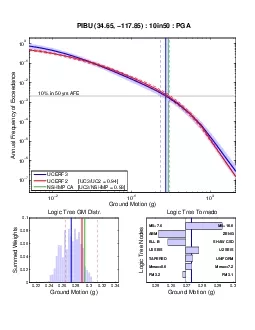
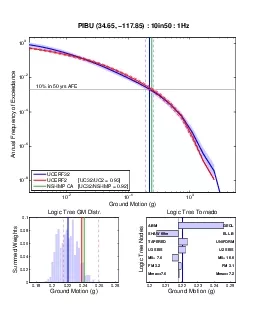
1 UCERF32 Hazard Implications Hazard comparison metrics Inversion testing C onvergence and eqn set weighting Hazard maps Influence of logic tree branches Contributions to changes in hazard ID: 811554

sources 2013 usgs nshmp 2013 sources nshmp usgs workshop hazard faults rate change fault ucerf3 ratio pga black san

Share:

Link:

Embed:

Download Presentation from below link

Download The PPT/PDF document "2/21/2013 2013 USGS NSHMP CA Workshop II" is the property of its rightful owner. Permission is granted to download and print the materials on this web site for personal, non-commercial use only, and to display it on your personal computer provided you do not modify the materials and that you retain all copyright notices contained in the materials. By downloading content from our website, you accept the terms of this agreement.


Presentation Transcript

Slide1

2/21/2013

2013 USGS NSHMP CA Workshop II

1

UCERF3.2: Hazard Implications

Hazard

comparison

metrics

Inversion testing

C

onvergence and eqn. set weighting

Hazard maps

Influence of logic tree branches

Contributions to changes in hazard

Hazard

curves at

sites

Slide2

Hazard Evaluation: Metrics

Ground motion values:

2% in 50 years (Prob. Exceed.)

10% in 50 years (Prob. Exceed.)RTGM (1% Prob. Collapse in 50 yr.)

Frequencies

PGA

5Hz1Hz Curves: NEHRP (2009) Test Cities Other WGCEP, PBRMaps: Full logic-tree for PGA (1440 branches) Partial tree for 1Hz (40 branches)

2/21/2013

2013 USGS NSHMP CA Workshop II

2

Slide3

Hazard Metrics: RTGM

Risk Targeted Ground Motion

(RTGM)Adopted by BSSC in conjunction with 2009 NEHRP provisionsGround motion for 1% probability of collapse in 50 years

Computed at frequencies: 5Hz and 1HzScalar valuedConsiders entire hazard curve

2/21/2013

2013 USGS NSHMP CA Workshop II

3

Slide4

Hazard Curves: Inversion Convergence

2/21/2013

2013 USGS NSHMP CA Workshop II

4

San Diego

PGA

San Francisco

1Hz

Examine variation over repeated inversion

runs

Single “reference”

branch

100 runs

Slide5

Hazard Curves: Inversion

Eqn. Weights

2/21/20132013 USGS NSHMP CA Workshop II

5

San Diego

PGA

San Francisco

1Hz

Examine effect of varying inversion equation weights

11 weight variants

Slide6

Hazard Maps: UC2 vs. UC3

2/21/2013

2013 USGS NSHMP CA Workshop II

6

Slide7

Hazard Ratio

s: Grid vs. Fault Sources

2/21/2013

2013 USGS NSHMP CA Workshop II

7

Slide8

Hazard Ratios

: Grid Source Comparison

2/21/20132013 USGS NSHMP CA Workshop II

8

Slide9

Hazard Ratios: Smooth Seis

. Comparison

2/21/2013

2013 USGS NSHMP CA Workshop II

9

Slide10

Branch Ratios: Fault Models

2/21/2013

2013 USGS NSHMP CA Workshop II

10

Slide11

Branch Ratios: Deformation Models

2/21/2013

2013 USGS NSHMP CA Workshop II

11

Slide12

Branch Ratios: Magnitude Scaling Rel.

2/21/2013

2013 USGS NSHMP CA Workshop II

12

Slide13

Branch Ratios: Dsr

(slip along rupture)

2/21/20132013 USGS NSHMP CA Workshop II

13

Slide14

Branch Ratios: M≥5 rate

2/21/2013

2013 USGS NSHMP CA Workshop II

14

Slide15

Branch Ratios: Off-fault M

max

2/21/20132013 USGS NSHMP CA Workshop II

15

Slide16

Branch Ratios: Smoothed Seis

. models

2/21/20132013 USGS NSHMP CA Workshop II

16

Slide17

Hazard Ratio: Sources of Change

Explain all non-yellow areas

Smoothed seismicity model

New faults, slip changes, or Mo rate changesMethodological changes

Slide18

S

hows

influence of

Mmax

&

total

M≥5 rate increase for gridded seismicityUCERF 3.2 / NSHMP08 Grid Sources Only(and using only U2 Smoothed Seis.)

Sources of

Change: Mmax & M≥5 rate

Slide19

Shows influence of

tighter U3

Smoothed

Seis. Model

UCERF 3.2 / NSHMP08

Grid Sources

Only(using both U2 & U3 Smoothed Seis.)

Artifact of “Deep seismicity” being excluded from denominator map

Sources

of

Change: Artifacts

Slide20

UCERF 3.2 / NSHMP08

Grid Sources

Only

(using both U2 & U3 Smoothed

Seis

Map)

Influenced by UCERF3 smoothed- seismicity branch

Shows influence of

tighter U3

Smoothed

Seis

. Model

Sources

of

Change: Grid Sources

Slide21

UCERF3/UCERF2

Mo Rate

Big Lagoon

-

Bald

Mtn

:

Extended

N ~60 km, and moment rate ~8 times higher on ABM

Log10(Mo ratio); new faults

are

black

Sources of Change:

Fault Sources

Slide22

New

faults:

Klamath

Falls Lake E &

W

UCERF3/UCERF2

Mo Rate

Log10(Mo ratio); new faults

are

black

Sources of Change: Fault Sources

Slide23

Gillem

and Cedar

Mtn.

faults have lower slip rates

UCERF3/UCERF2

Mo Rate

Log10(Mo ratio); new faults

are

black

Sources of Change: Fault Sources

Slide24

Four new faults

Likely

Fault

(moment

rate

doubled)

UCERF3/UCERF2

Mo Rate

Log10(Mo ratio); new faults

are

black

Sources of Change: Fault Sources

Slide25

8 new faults

(ABM rates high due to block boundary)

Maacama

(

20% increase in moment rate)

West Napa

(factor of 3.5 increase in

Mo rate

, ABM about 4 times higher than others)

UCERF3/UCERF2

Mo Rate

Log10(Mo ratio); new faults

are

black

Sources of Change: Fault Sources

Slide26

Great Valley 07 (

Orestimba

)

moment

rate

went down by ~60%

New

Great

V

alley

faults

UCERF3/UCERF2

Mo Rate

Log10(Mo ratio); new faults

are

black

Sources of Change: Fault Sources

Slide27

Calaveras (So) -

Paicines

extension

Complex

combination of new faults and geometric and rate changes

UCERF3/UCERF2

Mo Rate

Log10(Mo ratio); new faults

are

black

Sources of Change: Fault Sources

Slide28

N

ew fault:

Oceanic

– West

Hausna

(

NeoKinema

rate more

than 4 times higher than

others)

3 new

faults

UCERF3/UCERF2

Mo Rate

Log10(Mo ratio); new faults

are

black

Sources of Change: Fault Sources

Slide29

N

ew fault:

Lost Hills

Mix of

new faults

& gridded

sources

New faults in Mojave

UCERF3/UCERF2

Mo Rate

Log10(Mo ratio); new faults

are

black

Sources of Change: Fault Sources

Slide30

New

Fault:

Cerro

Prieto

N

ew

faults

:

San Clemente

San

Diego

Trough

Santa Cruz Catalina

Ridge

San Pedro Basin

UCERF3/UCERF2

Mo Rate

Log10(Mo ratio); new faults

are

black

Sources of Change: Fault Sources

Slide31

Cucamonga:

biggest methodological change

Death Valley Faults

(North

,

South

, and

Black

M

tn.

F

rontal

): moment rates went down ~40%

UCERF3/UCERF2

Mo Rate

Log10(Mo ratio); new faults

are

black

Sources of Change: Fault Sources

Slide32

Anacapa

Dume

:

moment rate down by factor of 3

UCERF3/UCERF2

Mo Rate

Log10(Mo ratio); new faults

are

black

Sources of Change: Fault Sources

Slide33

Addition of, or moment rate change on faults

UCERF3/UCERF2

Mo Rate

Log10(Mo ratio); new faults

are

black

Slide34

Hazard Analysis Sites

2/21/2013

2013 USGS NSHMP CA Workshop II

34

Slide35

Hazard Analysis Sites

2/21/2013

2013 USGS NSHMP CA Workshop II

35

Slide36

Hazard Curves:

Blue:

Logic tree weighted mean hazard curve (UC3)

Light Blue: Logic tree min max hazard curve range

Red:

UC2 logic tree weighted mean (solid), min and max (dashed) hazard curvesGreen: NSHMP reference valueGround motion histogram of logic tree branches summed over

weightsTornado diagram

2/21/2013

2013 USGS NSHMP CA Workshop II

36

Slide37

Hazard Curves: Los Angeles

2/21/2013

2013 USGS NSHMP CA Workshop II

37

PGA

1Hz

Slide38

Hazard Curves: San Francisco

2/21/2013

2013 USGS NSHMP CA Workshop II

38

PGA

1Hz

Slide39

Sites with changes > 10%

2/21/2013

2013 USGS NSHMP CA Workshop II

39

Site

Group

change

Redding

WGCEP287%

Brookings

WGCEP

257%

San Diego

NEHRP

137%

Carson City

WGCEP

127%

Long Beach

NEHRP

122%

Vallejo

NEHRP

121%

Northridge

NEHRP

119%

Big Sur

WGCEP

118%

Century City

NEHRP

114%

Site

Group

change

San Bernardino

WGCEP

88%

Malibu West

WGCEP

86%

Eureka

NEHRP

86%

Palmdale

WGCEP

85%

Santa Rosa

NEHRP

83%

Oakland

NEHRP

82%

Death Valley

NEHRP

64%

Cucamonga

WGCEP

59%

Slide40

Hazard Curves: Redding (

x3)

2/21/2013

2013 USGS NSHMP CA Workshop II

40

PGA

1Hz

Slide41

Grid & Fault Conributions

: Redding

2/21/20132013 USGS NSHMP CA Workshop II

41

Slide42

Hazard Curves: San Diego (

140%)

2/21/2013

2013 USGS NSHMP CA Workshop II

42

PGA

1Hz

Slide43

Hazard Curves: Vallejo

(120%)

2/21/2013

2013 USGS NSHMP CA Workshop II

43

PGA

1Hz

Slide44

Hazard Curves: San Bernardino

(88%

)2/21/2013

2013 USGS NSHMP CA Workshop II

44

PGA

1Hz

Slide45

Hazard Curves: Oakland

(82%)

2/21/2013

2013 USGS NSHMP CA Workshop II

45

PGA

1Hz

Slide46

Hazard Curves: Cucamonga

(50%)

2/21/2013

2013 USGS NSHMP CA Workshop II

46

PGA

1Hz

Slide47

Hazard Ratios: PGA vs. 1Hz

2/21/2013

2013 USGS NSHMP CA Workshop II

47

Slide48

Hazard Ratios: PGA vs. 1Hz

2/21/2013

2013 USGS NSHMP CA Workshop II

48

Slide49

Hazard Ratios: Logic-Tree Weight Variation

2/21/2013

2013 USGS NSHMP CA Workshop II

49

Slide50

Continued UCERF3 analysis…

Branch averaged solutions

DeaggregationStacked histograms of ground motion distribution at sites for each logic tree node (branch correlations)

Repeat convergence and equation weight testsHigher resolution maps around San Francisco and Los AngelesHazard

analyses online:

http://

opensha.usc.edu/ftp/pmpowers/UCERF3.2/2/21/2013

2013 USGS NSHMP CA Workshop II

50