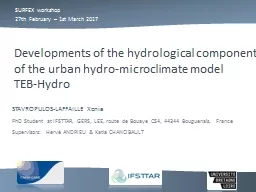
hydromicroclimate model TEBHydro SURFEX workshop 27th February 1st March 2017 STAVROPULOSLAFFAILLE Xenia PhD Student at IFSTTAR GERS LEE route de Bouaye CS4 44344 Bouguenais ID: 810812
Download The PPT/PDF document "Developments of the hydrological compon..." is the property of its rightful owner. Permission is granted to download and print the materials on this web site for personal, non-commercial use only, and to display it on your personal computer provided you do not modify the materials and that you retain all copyright notices contained in the materials. By downloading content from our website, you accept the terms of this agreement.
Slide1
Developments of the hydrological component of the urban hydro-microclimate model TEB-Hydro
SURFEX workshop
27th February – 1st March 2017
STAVROPULOS-LAFFAILLE Xenia
PhD Student at IFSTTAR, GERS, LEE, route de
Bouaye
CS4, 44344 Bouguenais, FranceSupervisors: Hervé ANDRIEU & Katia CHANCIBAULT
Slide2Context
Model TEB-Hydro
Methodology
Results and discussion
Conclusion and perspectives
2
Slide3Introduction
Context
Population
growth
in
cities
Expansion and densification of urban surfaces Augmentation of anthropic emissions Influence on the hydrological cycle:Source: http://www.localwom.com
Evapotranspiration
Infiltration
Runoff
Source
: http://www.exponantes.com
Evapotranspiration
Infiltration
Runoff
Urbanisation
0%
75% - 100%
Source: WMO (2008)
Latent heat fluxes
Sensible heat fluxes
Latent heat fluxes
3
Slide44
Context
Urban development strategies
Urban
scales?
Hydrologic
and energetic processes?Increase of impact studies on urban hydrology
Continuous regime or extreme events?
Climate and demographic changes
Alternative storm water management
Alternative thermic management
Role of vegetation
In cities
Slide55
Context
Objectif
Development of a hydro-microclimate model adapted to urban scales in order to evaluate adaptation strategies to global change.
Better understanding of urban hydrological processes and their reproduction within the model.
Energetic component
Hydrologic component
TEB-Hydro
Sensitivity analyses / Calibration
Validation
Slide6Hydro-microclimate model: TEB-Hydro
Model
Resolution of the water and energy balance by TEB
(Masson, 2000)
coupled with ISBA-DF
(Boone et al., 1999)
Street canyon approach (Oke, 1987)Integration of natural surfaces (Lemonsu et al., 2012; De Munck et al., 2014) and water fluxes in the urban subsoil (Chancibault et al., 2014)3 compartments “building”, “road” and “garden”
Water balance
Energy
balance
Source: http
://www.cnrm-game-meteo.fr
6
Source:
Lemonsu
et al. (2012)
Slide77
Model
Hydrological processes:
TEB-Hydro
Building
Garden
Road
ETP
INFILTRATION
RUNOFF
RUNOF
F
VERTICAL & HORIZONTAL TRANSFER
DEEP DRAINAGE
DEEP DRAINAGE
SEWER DRAINAGE
Slide8Horizontal water exchanges between the 3 compartments within a single grid cell
Drainage processes by the sewer system
When
soil water content reaches field
capacity
Drainage depends on
hydraulic
conductivity, the sewer
watertightness
, the sewer density and the ratio of water content to water content at saturation
Limitation of deep
drainage
if
Improvements of hydrological processes in
urban sub-soil
(
Chancibault
et al., 2014 ; Allard, 2015 ;
Chancibault
et al., 2015)
Model
WG
GARDEN
WG
ROAD
WG
BUILDING
WG
AVERAGE
Slide9Etudes antérieures:Rezé: Dupont (2001), Rodriguez et al. (2003
), Berthier et al. (2004), Lemonsu
et al. (2007), Rodriguez et al. (2008)
Pin Sec: Le Delliou et al. (2009), Musy et al. (2009), Ruban et al. (2010
), Furusho (2012),
Jankofsky (2012), Percot (2012), Rodriguez et al. (2014)
Methodo.Experimental sites in Nantes9CatchmentRezéPin SecClimate
Oceanic
(~800mm/a)
Area
4,7 ha
31 ha
Type
Residential
H
avg
=5,9m
(single
housing
)
Residential
H
avg
=9,3m
(single & shared housing)
Occupation
55%
gardens
,
17% buildings,
28%
roads
49%
gardens
,
19% buildings,
32%
roads
Imp. surfaces
connected
to
sewer
85%
65%
Impermeability
45%
51%
Source: Dupont (2001)
Source: Le
Delliou
et al. (2009)
Rezé
Pin Sec
Nantes
Paris
Toulouse
Slide10Model settings
SURFEX v7.3
Application on a single grid cell (1D)
Set of data over several years (in-situ and continuous instrumentation)
Rezé: 1993-1998
Pin Sec: 2010-2012Off-line modeforcing by meteorological data (station of Météo-France)Δt forcing = 60 minΔt numeric = 5 min
Methodo.
Application of the model
10
Slide11Methodo
.
Parameters of the model:
SROOF
I
ROAD
Z0TOWN
IP
CONN
SOILCLAY
SOILSAND
11
SROOF
Sensitivity analyses
Calibration
SROAD
Outcome variable
Simulation
Criterion
KGE
MIN
MAX
RUNOFF_Town
SROOF
0,92
0,94
SROAD
0,99
0,94
IROAD
0,94
0,39
CONN
0,84
0,93
Z0TOWN
0,97
0,98
RUNOFF_Sewer
IP
-0,28
-2,40
WG
SOILCLAY
0,72
0,84
SOILSAND
0,59
0,60
Slide12Characteristics of the Rezé catchment:
Silty
clay
Vegetation:100
% low vegetation (LV) Simulation period 1993-1998
Results
12
Rezé
catchment
Validation on
sewer discharge
Max. observed discharge in the sanitary sewer due to soil water infiltration in winter 1994/95
(
Berthier
1999)
:
Q
obs
=0.008 m
3
/h/m
10.3 m
3
/h
Calibration
IROAD
10
-5
(
m/s)
IP
0.04 (-)
Sewer discharge due to soil water infiltration
Q
sim
= 9.8 m
3
/h
Slide13Water content in the sewer soil layer
Sewer discharge due to soil water infiltration
Results
13
Same model settings as for Rezé
Characteristics of the Pin Sec catchment
Silty
sand
Vegetation:
38%
low
vegetation
(LV), 25%
high
vegetation
(HV),37%
bare
soil
(BS
)
Simulation
period 2010-2012
Pin Sec catchment
WG
fc
Simulation
Soil
texture
Natural
surfaces
ETP [%]
Sim 1
silty
sand
LV+HV+BS
86
Sim 2
silty
sand
LV
74
Sim 3
silty
clay
LV+HV+BS
88
Sim 4
silty
clay
LV
75
WG
fc
Slide14Conclusion and Perspectives
Sensitivity analyses identified parameters for calibration:
IROAD, CONN, IP, SOILCLAY, SOILSANDHydrologic validation on two small urban catchments:
Rezé: Validation on sewer discharge Application on another catchment opens new questions:
Soil texture and hydraulic conductivity at saturation: sandy soils represent a high drainage capacityRepresentation of urban vegetation: Evapotranspiration is too important for an urban catchment
SURFEX v8New developments of representation of trees (E. Redon)
Conclusion& Persp.14
Slide15Thank you for your attention !
SURFEX workshop
27th
February – 1st March 2017
Image: http://fr.123rf.com
Any
questions?
Slide16 Critère statistique de Kling-Gupta (KGE) (Gupta et al. 2009)
Avec :
le coefficient de corrélation linéaire (r) entre les variables simulées et de
référence:
la variabilité relative (α) représentée par le quotient des écarts-types sur les variables simulées et de
référence:
le biais (
β):
Représentation des Résultats
Résultats
16