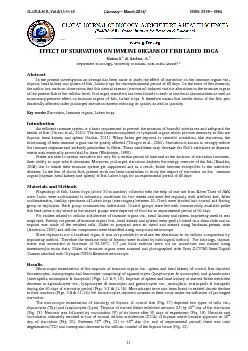
/
Vital signs Vital signs reflect the functional status of vital organs in the body and Vital signs Vital signs reflect the functional status of vital organs in the body and

Vital signs Vital signs reflect the functional status of vital organs in the body and - PowerPoint Presentation

gutsynumero
gutsynumero . @gutsynumero
Follow
356 views
Uploaded On 2020-06-13

Vital signs Vital signs reflect the functional status of vital organs in the body and - PPT Presentation

Temperature Blood pressure Pulse Respiratory rate Oxygen saturation Blood glucose Temperature units are either centigrade C or Fahrenheit F and to change Fahrenheit to centigrade the formula used is F 32 X 59 C ID: 776878

Share:

Link:

Embed:

Download Presentation from below link

Download The PPT/PDF document "Vital signs Vital signs reflect the func..." is the property of its rightful owner. Permission is granted to download and print the materials on this web site for personal, non-commercial use only, and to display it on your personal computer provided you do not modify the materials and that you retain all copyright notices contained in the materials. By downloading content from our website, you accept the terms of this agreement.


Presentation Transcript

Slide1

Vital signs

Slide2

Vital signs reflect the functional status of vital organs in the body and they include

:

Temperature,

Blood

pressure,

Pulse,

Respiratory rate,

Oxygen

saturation

,

Blood glucose.

Slide3

Temperature

units

are either centigrade (C) or Fahrenheit (F) and to change Fahrenheit to centigrade, the formula used is (F – 32) X 5/9 = ˚C

and to change centigrade to Fahrenheit, it is (C X 9/5) + 32 = ˚F.

Slide4

Temperature

Condition

36.6 – 37.2 ˚C

Normal

< 35 ˚C

Hypothermia

< 36.6˚ C

Subnormal

> 37.2˚ C

Febrile (pyrexia)

> 41.6˚ C

Hyperpyrexia

Slide5

Temperature: record the patient's temperature using either a mercury or electronic thermometer. The recording will vary according to:

1. Site of measurement: Normal oral temperature is usually considered, whereas rectal route is 0.5 °C higher and

axillary

route is 0.5 °C lower.

2. Diurnal variation in body temperature, with peak temperatures occurring between 6 pm - 10 pm, lowest between 2 am - 4 am.

3. Menstrual cycle can elevate temperature by 1 °C degree.

4. Physical activity.

5. Strong emotion.

6. Eating.

7. Heavy clothing.

8. Medications.

9. High room temperature.

10. High humidity.

Slide6

Clinical conditions:

Persistent pyrexia

may be a sign of typhoid fever.

Intermittent pyrexia

can be seen in

pyogenic

infections such as TB.

Relapsing pyrexia

occurs in patient with Hodgkin's disease and is characterized by 4 days of persistent fever which then returns to baseline before rising again

.

Slide7

Any

rigors

(uncontrollable shaking) which may accompany high fever are often characteristic of

biliary

sepsis or

pyelonephritis

.

Hypothermia

occurs usually from cold exposure or following excess alcohol or in the elderly with hypothyroidism (e.g

.

myxoedema

).

Patients typically

lose consciousness

at temperatures < 27 °C.

Brain dam

age

from a fever generally will not occur unless the fever is over 107.6°F (42°C).

Heatstroke

is a dangerous type of high temperature, because the body is not able to stop the temperature from rising continuously. It can happen when a child is left in a hot car or when someone exercises too strenuously without enough water drink.

Slide8

Procedure: Oral route

-Hold

the thermometer from the end away from the bulb with your thumb and index finger.

-Lower

the mercury level by shaking the thermometer to below 35˚ C.

-Wash

the thermometer by antiseptic solution with cotton wool.

-Place

the bulb of thermometer underneath the tongue and ask the patient to close his lips and breathe from his nose, for 2 min. then read the temp. At the level of mercury column .wash the thermometer and put it place.

Slide9

Its unit in mmHg.

B.P. = cardiac output (COP) x peripheral vascular resistance (PVR)

COP = heart rate (HR) x stroke volume (SV)

Systolic pressure

: The highest arterial pressure during each cardiac cycle. It is measured after the heart contract and blood is ejected into the arterial system.

Diastolic pressure

: lowest arterial pressure during each cardiac cycle. It is measured when the heart is relaxed.

Slide10

Pulse pressure

: is the difference between systolic and diastolic pressure.

Mean arterial pressure

: is the average of arterial pressure with respect to time. (mean arterial pressure = diastolic pressure + 1/3 pulse pressure.

B.P. affected by the following factors:

1. COP directly correlated with systolic B.P.

2. PVR directly correlated with diastolic B.P.

Slide11

Methods to measure B.P.:

A. Directly through

cannula

in the artery.

B. Indirectly through:

1.

Oscillometric

methods with an electronic pressure sensor (transducer) fitted in to detect blood flow with a numerical readout of blood pressure. This method is a subject to the errors and drift of calibration.

2.

Auscultatory

-

palpatory

method uses a stethoscope, sphygmomanometer which comprises an inflatable cuff placed around the upper arm at roughly the same vertical height as the heart, attached to a mercury or aneroid manometer. This method is not subject to the errors.

Slide12

Procedure:

Rest the patient for five minutes

1- In ambulant patients, measurements are normally made with the patient seated. Either arm can be used (difference between left and right should be < 10 mmHg).

2- Check the proper size of air bag within the cuff which should extend for at least 2/3 of the circumference of the arm.

2- Support the patient's arm comfortably at about heart level.

3- Apply the cuff to the upper arm with the center of the bladder over the brachial artery above the

cubital

fossa

by 2.5 cm, wrapping should be neither tight nor loose.

Slide13

4- Palpate the brachial pulse.

5- Inflate the cuff until the pulse is impalpable. Note the pressure on the manometer. This is a rough estimate of systolic pressure.

6- Now inflate the cuff another 10 mmHg and listen through the stethoscope over the brachial artery.

7- Deflate the cuff slowly until regular sounds are first heard. Note the reading to the nearest 2 mmHg. This is the systolic pressure (first

Korotkoff

sound).

8- Continue to deflate the cuff slowly until the sounds disappear (fifth

Korotkoff

sound). Record the pressure at which the sounds completely disappear as diastolic pressure. Occasionally muffled sounds persist and do not disappear, in which case the point of muffling is the best guide to the diastolic pressure..

Note:

The cuff size should be correct: undersized cuffs yields too high pressure, whereas oversized cuffs yields too low pressure.

Slide14

Slide15

Slide16

Clinical points:

Blood pressure varies with excitement, stress and environment. Repeated measurements, made 0n 0ne week apart, in a stress-free environment, are required to diagnose hypertension. In some patients simply measuring blood pressure can cause it to rise - so-called 'white coat' hypertension. Ambulatory blood pressure monitoring removes the stress of the clinic environment and helps identify this problem. Numerous devices can be set to make BP measurements at set intervals for 24 hours. Many patients also can use automatic machines which allow them to measure their own BP at home.

Slide17

category

systolic

Diastolic

Normal

<120

80

>

Prehypertension

130-139

85-89

Stage I hypertension

140-159

90-99

Stage II hypertension

≥160

≥100

Hypertensive crisis

> 180

> 110

Slide18

Hypertension has no specific symptoms but, if untreated, can lead to death or morbidity from heart failure,

cerebrovascular

accident or renal failure.

It is a major risk factor for coronary heart disease and

atrial

fibrillation.

Pulse rate:

Assess the radial pulse to determine rate, rhythm, and volume.

Slide19

Radial pulse

1- Place your three middle fingers over the right radial pulse at the wrist, lateral to the flexor

carpi

radialis

tendon.

2- Use the pads of your fingers to assess the rate, rhythm and volume (Fig. 3.11A).

3- Count the pulse for 15 seconds and multiply by four to obtain the pulse rate in beats per minute (

bpm

).

4- Now palpate the left radial pulse. If either pulse feels diminished in volume, confirm any difference by simultaneous palpation.

Brachial pulse

1- Use your thumb (right thumb for right arm and vice versa) with your fingers cupped round the back of the elbow.

2- Feel in the

antecubital

fossa

medial to the tendon of the biceps muscle to find the pulse and assess its character.

Carotid pulse

1- Palpate the carotid pulse with the patient lying on couch in case you induce a

Slide20

reflex

bradycardia

.

2- Never compress both carotid arteries simultaneously.

3- Use your left thumb for the right carotid pulse and vice versa.

4- Place the tip of your thumb between the larynx and the anterior border of the

sternocleidomastoid

muscle.

5- Press your thumb gently backwards to feel the pulse.

Slide21

Normal findings

A normal adult resting pulse rate is between 60-100

bpm

.

Bradycardia

is a pulse rate of < 60

bpm

(as in cases of sleep, athlete, and hypothyroidism) and tachycardia > 100

bpm

(as in cases of anemia, pain, exercise, anxiety, fever, and

thyrotoxicosis

).

A normal cardiac rhythm is called sinus rhythm because it arises from the

sinoatrial

node. Sinus rhythm seldom produces a completely regular pulse because the heart speeds up during inspiration and slows at the beginning of expiration in response to changes in

vagus

nerve activity. This sinus arrhythmia is most obvious in children, young adults and athletes.

Cases of abnormal rhythm called

dysrhythmia

or arrhythmia which could be associated with tachycardia (tachyarrhythmia as in

supraventricular

tachycardia and

atrial

fibrillation) or associated with

bradycardia

(

bradyarrythmia

as in cases of heart block).

Slide22

Volume

Volume is the movement imparted to your fingers and reflects the pulse pressure.

A large volume pulse may be due to high cardiac output state as in cases of exercise, emotion, heat, pregnancy, fever,

thyrotoxicosis

, or

anaemia

.

A low volume pulse (thin and

thready

) is associated with reduced stroke volume due to heart failure, or

hypovolaemia

due to

haemorrhage

or dehydration.

Respiratory rate:

Count chest expansions over 15 seconds and multiply by four (normal rate = 12 – 18 breath per minute, else if higher it is

tachypnea

or lower which is

bradypnea

).

Slide23

Oxygen saturation

measured

by

pulse

oximetry

which is a non-invasive probe attached to fingertip or earlobe to assess peripheral O

2

saturation which is if < 92 % indicates hypoxia and need to check arterial blood gases (ABG) as PaCO

2

and PaO

2

.

Blood glucose:

using

glucometer

or glucose

Stix

test to check if there is

normoglycemia

, hypoglycemia, or hyperglycemia (refer to biochemistry values).