PPT-Approach Train the model to estimate N
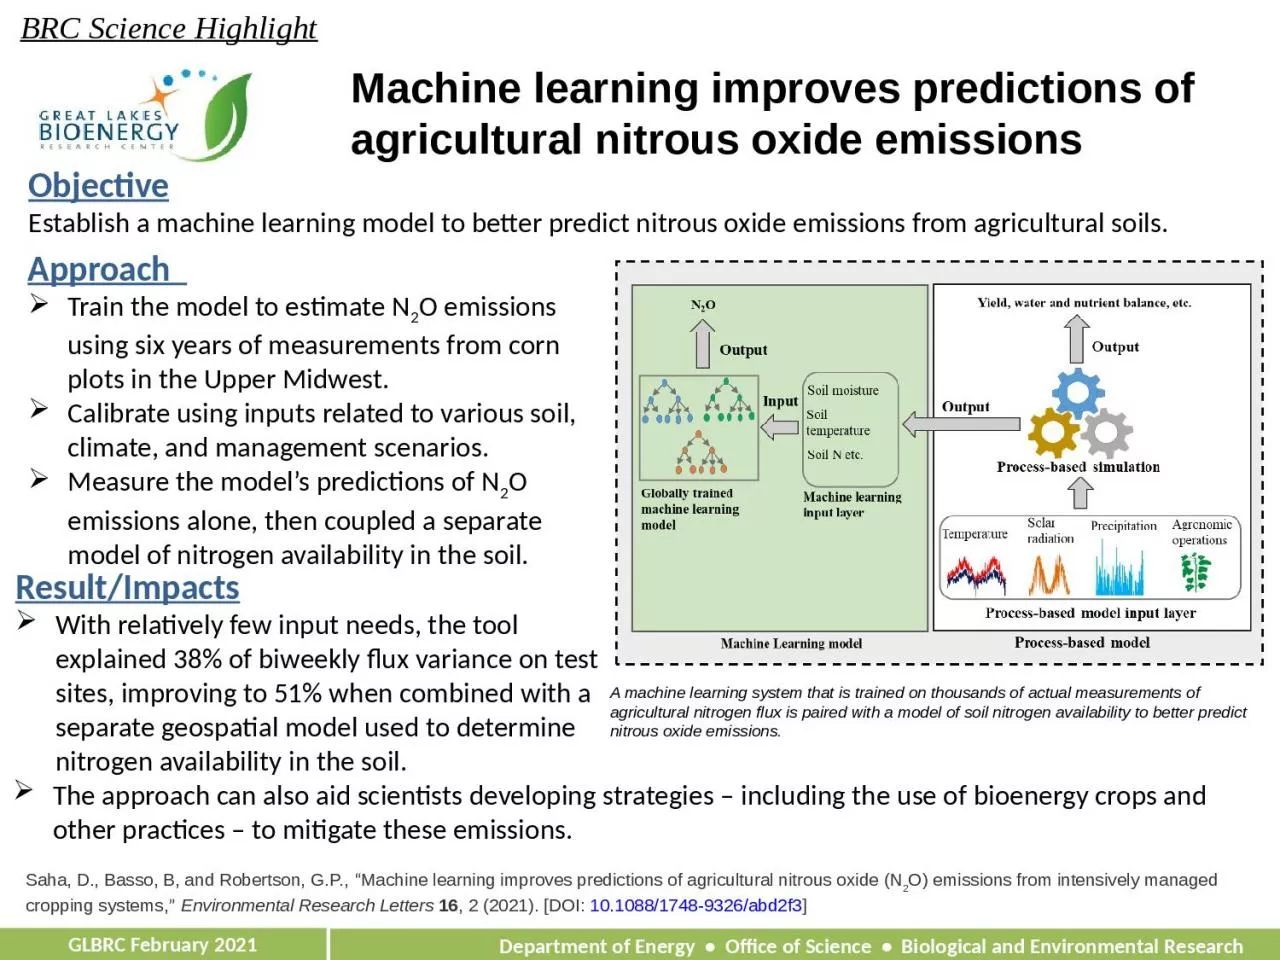
2 O emissions using six years of measurements from corn plots in the Upper Midwest Calibrate using inputs related to various soil climate and management scenarios
Download Presentation
"Approach Train the model to estimate N" is the property of its rightful owner. Permission is granted to download and print materials on this website for personal, non-commercial use only, provided you retain all copyright notices. By downloading content from our website, you accept the terms of this agreement.
Presentation Transcript
Transcript not available.