/
Collaboration-Driven Features of UCSF Chimera that Simplify Modeling and Animation Collaboration-Driven Features of UCSF Chimera that Simplify Modeling and Animation

Collaboration-Driven Features of UCSF Chimera that Simplify Modeling and Animation - PowerPoint Presentation

jade
jade . @jade
Follow
65 views
Uploaded On 2024-01-29

Collaboration-Driven Features of UCSF Chimera that Simplify Modeling and Animation - PPT Presentation

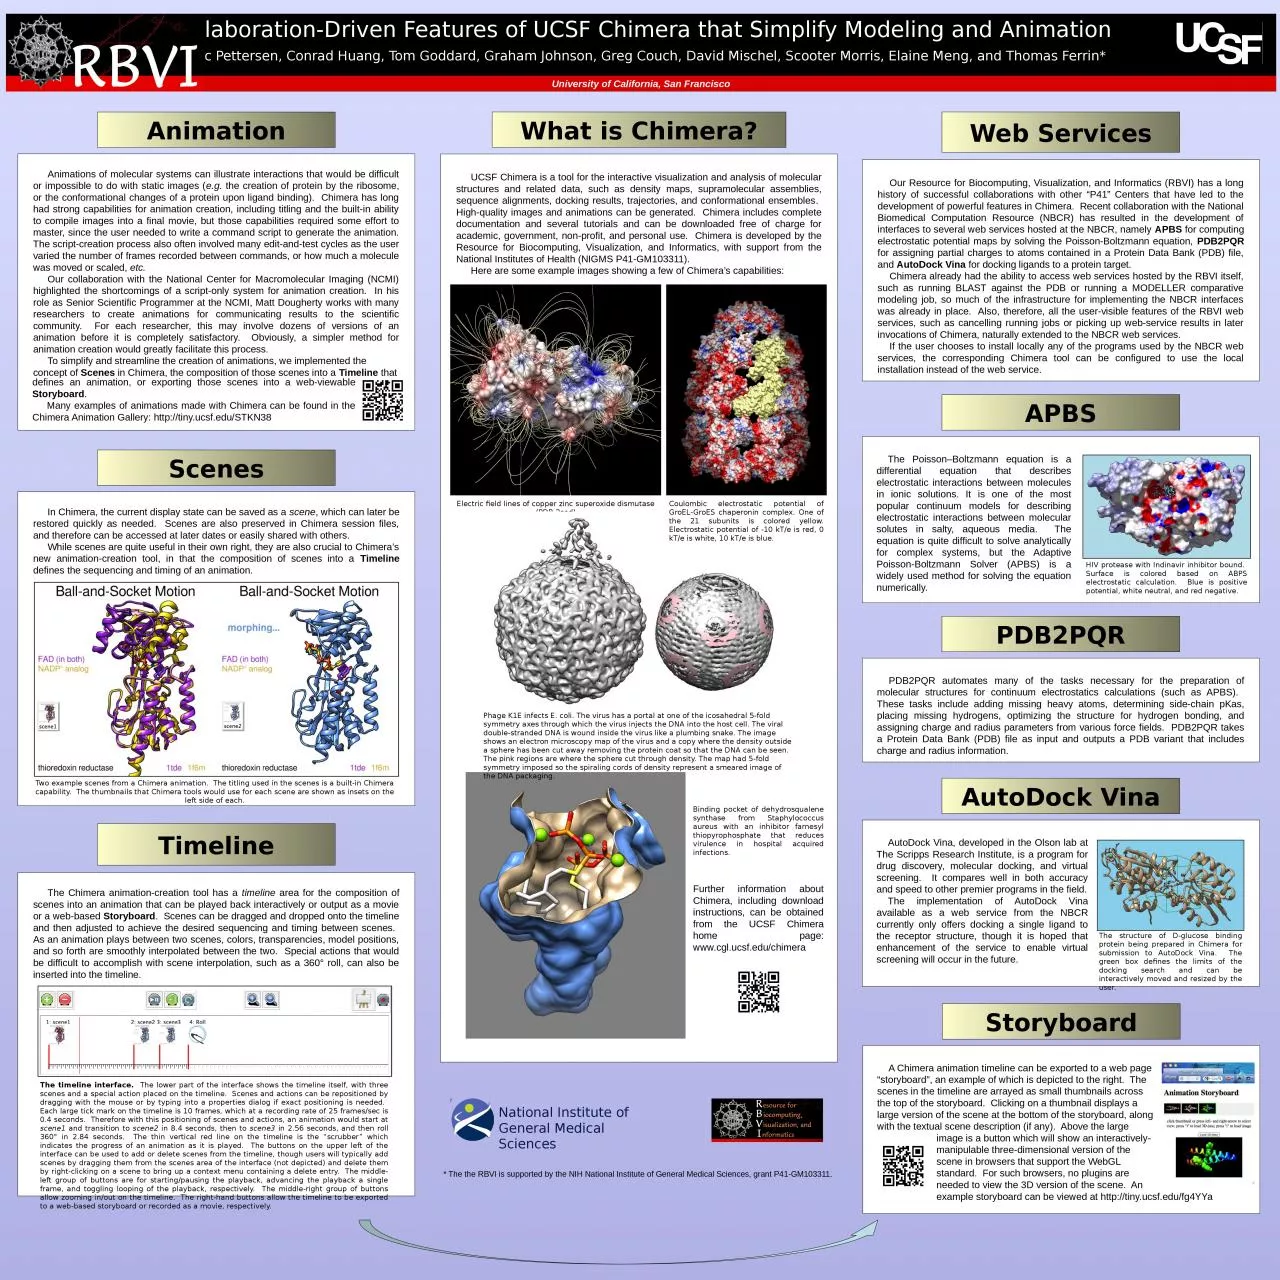
Eric Pettersen Conrad Huang Tom Goddard Graham Johnson Greg Couch David Mischel Scooter Morris Elaine Meng and Thomas Ferrin University of California San Francisco UCSF Chimera is a tool for the interactive visualization and analysis of molecular structures and related data ID: 1043078

scenes chimera timeline animation chimera scenes animation timeline web creation scene protein electrostatic nbcr storyboard services national docking pdb

Share:

Link:

Embed:

Download Presentation from below link

Download Presentation The PPT/PDF document "Collaboration-Driven Features of UCSF Ch..." is the property of its rightful owner. Permission is granted to download and print the materials on this web site for personal, non-commercial use only, and to display it on your personal computer provided you do not modify the materials and that you retain all copyright notices contained in the materials. By downloading content from our website, you accept the terms of this agreement.


Presentation Transcript

1. Collaboration-Driven Features of UCSF Chimera that Simplify Modeling and AnimationEric Pettersen, Conrad Huang, Tom Goddard, Graham Johnson, Greg Couch, David Mischel, Scooter Morris, Elaine Meng, and Thomas Ferrin*University of California, San FranciscoUCSF Chimera is a tool for the interactive visualization and analysis of molecular structures and related data, such as density maps, supramolecular assemblies, sequence alignments, docking results, trajectories, and conformational ensembles. High-quality images and animations can be generated. Chimera includes complete documentation and several tutorials and can be downloaded free of charge for academic, government, non-profit, and personal use. Chimera is developed by the Resource for Biocomputing, Visualization, and Informatics, with support from the National Institutes of Health (NIGMS P41-GM103311).Here are some example images showing a few of Chimera’s capabilities:What is Chimera?Web ServicesOur Resource for Biocomputing, Visualization, and Informatics (RBVI) has a long history of successful collaborations with other “P41” Centers that have led to the development of powerful features in Chimera. Recent collaboration with the National Biomedical Computation Resource (NBCR) has resulted in the development of interfaces to several web services hosted at the NBCR, namely APBS for computing electrostatic potential maps by solving the Poisson-Boltzmann equation, PDB2PQR for assigning partial charges to atoms contained in a Protein Data Bank (PDB) file, and AutoDock Vina for docking ligands to a protein target.Chimera already had the ability to access web services hosted by the RBVI itself, such as running BLAST against the PDB or running a MODELLER comparative modeling job, so much of the infrastructure for implementing the NBCR interfaces was already in place. Also, therefore, all the user-visible features of the RBVI web services, such as cancelling running jobs or picking up web-service results in later invocations of Chimera, naturally extended to the NBCR web services.If the user chooses to install locally any of the programs used by the NBCR web services, the corresponding Chimera tool can be configured to use the local installation instead of the web service.National Institute ofGeneral Medical Sciences* The the RBVI is supported by the NIH National Institute of General Medical Sciences, grant P41-GM103311.Electric field lines of copper zinc superoxide dismutase (PDB 2sod)Coulombic electrostatic potential of GroEL-GroES chaperonin complex. One of the 21 subunits is colored yellow. Electrostatic potential of -10 kT/e is red, 0 kT/e is white, 10 kT/e is blue.Phage K1E infects E. coli. The virus has a portal at one of the icosahedral 5-fold symmetry axes through which the virus injects the DNA into the host cell. The viral double-stranded DNA is wound inside the virus like a plumbing snake. The image shows an electron microscopy map of the virus and a copy where the density outside a sphere has been cut away removing the protein coat so that the DNA can be seen. The pink regions are where the sphere cut through density. The map had 5-fold symmetry imposed so the spiraling cords of density represent a smeared image of the DNA packaging.Binding pocket of dehydrosqualene synthase from Staphylococcus aureus with an inhibitor farnesyl thiopyrophosphate that reduces virulence in hospital acquired infections.Further information about Chimera, including download instructions, can be obtained from the UCSF Chimera home page: www.cgl.ucsf.edu/chimeraAnimations of molecular systems can illustrate interactions that would be difficult or impossible to do with static images (e.g. the creation of protein by the ribosome, or the conformational changes of a protein upon ligand binding). Chimera has long had strong capabilities for animation creation, including titling and the built-in ability to compile images into a final movie, but those capabilities required some effort to master, since the user needed to write a command script to generate the animation. The script-creation process also often involved many edit-and-test cycles as the user varied the number of frames recorded between commands, or how much a molecule was moved or scaled, etc.Our collaboration with the National Center for Macromolecular Imaging (NCMI) highlighted the shortcomings of a script-only system for animation creation. In his role as Senior Scientific Programmer at the NCMI, Matt Dougherty works with many researchers to create animations for communicating results to the scientific community. For each researcher, this may involve dozens of versions of an animation before it is completely satisfactory. Obviously, a simpler method for animation creation would greatly facilitate this process.To simplify and streamline the creation of animations, we implemented the concept of Scenes in Chimera, the composition of those scenes into a Timeline thatAnimationdefines an animation, or exporting those scenes into a web-viewable Storyboard.Many examples of animations made with Chimera can be found in the Chimera Animation Gallery: http://tiny.ucsf.edu/STKN38The Chimera animation-creation tool has a timeline area for the composition of scenes into an animation that can be played back interactively or output as a movie or a web-based Storyboard. Scenes can be dragged and dropped onto the timeline and then adjusted to achieve the desired sequencing and timing between scenes. As an animation plays between two scenes, colors, transparencies, model positions, and so forth are smoothly interpolated between the two. Special actions that would be difficult to accomplish with scene interpolation, such as a 360° roll, can also be inserted into the timeline.TimelineIn Chimera, the current display state can be saved as a scene, which can later be restored quickly as needed. Scenes are also preserved in Chimera session files, and therefore can be accessed at later dates or easily shared with others.While scenes are quite useful in their own right, they are also crucial to Chimera’s new animation-creation tool, in that the composition of scenes into a Timeline defines the sequencing and timing of an animation.ScenesTwo example scenes from a Chimera animation. The titling used in the scenes is a built-in Chimera capability. The thumbnails that Chimera tools would use for each scene are shown as insets on the left side of each.The timeline interface. The lower part of the interface shows the timeline itself, with three scenes and a special action placed on the timeline. Scenes and actions can be repositioned by dragging with the mouse or by typing into a properties dialog if exact positioning is needed. Each large tick mark on the timeline is 10 frames, which at a recording rate of 25 frames/sec is 0.4 seconds. Therefore with this positioning of scenes and actions, an animation would start at scene1 and transition to scene2 in 8.4 seconds, then to scene3 in 2.56 seconds, and then roll 360° in 2.84 seconds. The thin vertical red line on the timeline is the “scrubber” which indicates the progress of an animation as it is played. The buttons on the upper left of the interface can be used to add or delete scenes from the timeline, though users will typically add scenes by dragging them from the scenes area of the interface (not depicted) and delete them by right-clicking on a scene to bring up a context menu containing a delete entry. The middle-left group of buttons are for starting/pausing the playback, advancing the playback a single frame, and toggling looping of the playback, respectively. The middle-right group of buttons allow zooming in/out on the timeline. The right-hand buttons allow the timeline to be exported to a web-based storyboard or recorded as a movie, respectively.APBSThe Poisson–Boltzmann equation is a differential equation that describes electrostatic interactions between molecules in ionic solutions. It is one of the most popular continuum models for describing electrostatic interactions between molecular solutes in salty, aqueous media. The equation is quite difficult to solve analytically for complex systems, but the Adaptive Poisson-Boltzmann Solver (APBS) is a widely used method for solving the equation numerically.HIV protease with Indinavir inhibitor bound. Surface is colored based on ABPS electrostatic calculation. Blue is positive potential, white neutral, and red negative.PDB2PQRPDB2PQR automates many of the tasks necessary for the preparation of molecular structures for continuum electrostatics calculations (such as APBS). These tasks include adding missing heavy atoms, determining side-chain pKas, placing missing hydrogens, optimizing the structure for hydrogen bonding, and assigning charge and radius parameters from various force fields. PDB2PQR takes a Protein Data Bank (PDB) file as input and outputs a PDB variant that includes charge and radius information.AutoDock VinaAutoDock Vina, developed in the Olson lab at The Scripps Research Institute, is a program for drug discovery, molecular docking, and virtual screening. It compares well in both accuracy and speed to other premier programs in the field.The implementation of AutoDock Vina available as a web service from the NBCR currently only offers docking a single ligand to the receptor structure, though it is hoped that enhancement of the service to enable virtual screening will occur in the future.The structure of D-glucose binding protein being prepared in Chimera for submission to AutoDock Vina. The green box defines the limits of the docking search and can be interactively moved and resized by the user.StoryboardA Chimera animation timeline can be exported to a web page “storyboard”, an example of which is depicted to the right. The scenes in the timeline are arrayed as small thumbnails across the top of the storyboard. Clicking on a thumbnail displays a large version of the scene at the bottom of the storyboard, along with the textual scene description (if any). Above the largeimage is a button which will show an interactively-manipulable three-dimensional version of the scene in browsers that support the WebGL standard. For such browsers, no plugins are needed to view the 3D version of the scene. Anexample storyboard can be viewed at http://tiny.ucsf.edu/fg4YYa