/
Analysis of US Cow-Calf Producer Survey Data to Assess Knowledge, Awareness and Analysis of US Cow-Calf Producer Survey Data to Assess Knowledge, Awareness and

Analysis of US Cow-Calf Producer Survey Data to Assess Knowledge, Awareness and - PowerPoint Presentation

jane-oiler
jane-oiler . @jane-oiler
Follow
344 views
Uploaded On 2019-11-21

Analysis of US Cow-Calf Producer Survey Data to Assess Knowledge, Awareness and - PPT Presentation

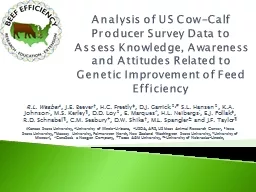
Analysis of US CowCalf Producer Survey Data to Assess Knowledge Awareness and Attitudes Related to Genetic Improvement of Feed Efficiency RL Weaber JE Beever HC Freetly DJ Garrick ID: 766317

bagger brown survey nbcec brown bagger nbcec survey feed 2014 genetic beef university improvement stakeholder efficiency state selection results2014

Share:

Link:

Embed:

Download Presentation from below link

Download Presentation The PPT/PDF document "Analysis of US Cow-Calf Producer Survey ..." is the property of its rightful owner. Permission is granted to download and print the materials on this web site for personal, non-commercial use only, and to display it on your personal computer provided you do not modify the materials and that you retain all copyright notices contained in the materials. By downloading content from our website, you accept the terms of this agreement.


Presentation Transcript

Analysis of US Cow-Calf Producer Survey Data to Assess Knowledge, Awareness and Attitudes Related to Genetic Improvement of Feed Efficiency R.L. Weaber * , J.E. Beever † , H.C. Freetly ‡ , D.J. Garrick §,# S.L. Hansen § , K.A. Johnson ¦ , M.S. Kerley ¶ , D.D. Loy § , E. Marques ^ , H.L. Neibergs ¦ , E.J. Pollak ‡ , R.D. Schnabel ¶ , C.M. Seabury + , D.W. Shike † , M.L. Spangler ± and J.F. Taylor ¶ * Kansas State University, † University of Illinois-Urbana, ‡ USDA, ARS, US Meat Animal Research Center, § Iowa State University, # Massey University, Palmerston North, New Zealand ¦ Washington State University, ¶ University of Missouri, ^ GeneSeek a Neogen Company, + Texas A&M University, ± University of Nebraska-Lincoln,

Importance of Feed EfficiencyFeed costs = 66% in calf feeding systems Feed costs = 77% in yearling finishing systems Anderson et al. 200510% improvement in gain = +18% profit10% improvement in efficiency = +43% profitFox et al. 2001Efficiency increases have 7-8 times the economic impact of comparable increasesin gainOkine et al. 2004 2014 NBCEC Brown Bagger

Value of Improved Efficiency in Feedlot Sector 2014 NBCEC Brown Bagger

National Program for the Genetic Improvement of Feed Efficiency in Beef Cattle Iowa State University Dr. Dorian Garrick Dr. Stephanie Hansen Dr. Dan Loy Dr. J.R. Tait Texas A&M University Dr. Chris Seabury University of Illinois Dr. Jon Beever Dr. Dan FaulknerDr. Dan ShikeUniversity of MinnesotaDr. Scott FahrenkrugUniversity of MissouriDr. Jerry Taylor, Project DirectorDr. Monty KerleyDr. Robert SchnabelKansas State UniversityDr. Robert WeaberUniversity of NebraskaDr. Matt SpanglerGeneSeek, A Neogen CompanyDr. Daniel PompUSDA-BELTSVILLEDr. Tad SonstegardUSDA-MARCDr. Harvey FreetlyDr. John PollakWashington State UniversityDr. Kris JohnsonDr. Holly Neibergs 2014 NBCEC Brown Bagger 20 investigators 10 institutions

ObjectivesDevelop understanding of stakeholder attitudes/behaviors related to:Importance of feed efficiencyFeed efficiency metricsMethods of genetic improvement Base line for determination of project impact Guide extension program developmentdeploymentStakeholder Survey2014 NBCEC Brown Bagger

Stakeholder SurveyStakeholder sampling USDA-NASS Producer sample (~7,500) Cow-calf (National)Feedyard (13 state region used for Cattle on Feed)Mailed September 18, 2013; non-respondents received second copy October 23, 2013Paper survey-55 questionsSurvey instrument reviewed and granted exemption (45 CFR §46.101, paragraph b, category: 2, subsection: ii) by K-State IRBDataset returned December 2, 2013Return rate: 11.6%2014 NBCEC Brown Bagger

RegionsStrata--Herd Size7          5,001 +            Beef Cows 6          2,501 – 5,000   Beef Cows 5          1,001 – 2,500   Beef Cows 4          501 – 1,000      Beef Cows3          251 – 500         Beef Cows2          101 – 250         Beef Cows1          100 and below  Beef CowsStakeholder Survey 2014 NBCEC Brown Bagger

Weighted frequencies and standard errors estimated using PROC SURVEYFREQ in SASMeans and standard errors estimated using PROC SURVEYMEANS in SASStratified sample designFrequencies weighted to account for unequal probability of inclusion in the sample 2014 NBCEC Brown Bagger Stakeholder Survey Statistical Analysis

Analysis focused on commercial cow-calf producers (n=269)93% Owners5.1% Managers1.8% OtherMean age 57.4 ± 1.9 y Mean experience 33.2 ± 1.6 y Farm/ranch cattle inventories of respondents83.1 ± 6.7 hd3.7% use of Artificial InseminationMean bull price US$ 1,887 ± 102Stakeholder Survey Results2014 NBCEC Brown Bagger

Respondent level of education38.3% 4 y college graduates23.3% some college27.3% high school graduates5.0% less than high school grad 6.3% no response Farm/ranch work as % of time 47.3% indicated greater than half-timeFarm/ranch income as % of family income29.9 ± 2.2%Stakeholder Survey Results2014 NBCEC Brown Bagger

Sources of breeding/genetics information38.9% unpaid consultant29.7% veterinarians29.5% extension professionals 27.7% seedstock producers 18.9% internet search 18.1% farm supply/feed store14.7% breed association personnel11.7% AI stud personnel9.3% popular press2.1% paid consultantsImportant to educate traditional trainers; but also direct communication to commercial and seedstockStakeholder Survey Results2014 NBCEC Brown Bagger

Decision making process in their business73.8% profitability greatest concern24.2% early adopters of new technologies77.0% let ideas prove themselves before adoption87.0% current management/selection sustainable 55.4% access new knowledge from media/program 40.1% rely on extension educators to teach new techniques 39.8% rely on seedstock/breed associationsfor new info on breeding/selectionpracticesStakeholder Survey Results2014 NBCEC Brown Bagger

Feed Efficiency Concepts32.5% correctly identified definition of F:G36.2% correctly identified definition of feed efficiency16.4% had heard of RFI 14.3% familiar of RADG 54.8% identified rate of gain as method used by industry historically to improve FE 40.6% improved diet formulation28.4% feed additives (ionophore/beta-agonist)35.2% implants24.2% didn’t know if any of the options were used~50% of respondents didn’t know of any negative consequence to cowherd due to selection for ADG; 13.4% no harmful effects;10.3% correctly answeredStakeholder Survey Results2014 NBCEC Brown Bagger

Feed Efficiency Concepts41.2% not knowledgeable of methods to select for improved efficiency28.8% slightly knowledgeable20.2% somewhat knowledgeable7.0% very knowledgeable 1.5% extremely knowledgeable Stakeholder Survey Results 2014 NBCEC Brown Bagger

Largest obstacle to genetic improvement of FE in beef industry11.9% lack of available facilities/equip9.7% lack of uniform guidelines8.3% no obstacles8.0% lack of demand for tested bulls 7.1% too expensive to collect ind. FI records~10% were aware of this projectStakeholder Survey Results2014 NBCEC Brown Bagger

Stakeholder Survey Results Frequency of use (SE) for various types of genetic prediction information used by beef producers during past five years and their anticipated future use.1 Data type Use past 5 years 2 Anticipated future use 2 Actual measurements 18.4 (3.0) 6.7 (1.8)Ratios21.6 (4.0)13.8 (3.3)Expected Progeny Differences29.9 (4.4)12.4 (3.4)Genomically Enhanced EPD5.6 (2.2)12.6 (3.0)Productivity of relatives16.4 (3.5)14.3 (3.7)Comments by seller17.6 (3.8)11.4 (3.0)DNA marker results2.8 (1.5)15.4 (3.1)None of above31.0 (4.9)42.5 (5.1)1Respondents could select more than one type of information used; column totals will not sum to 100%.2Percentage of respondents indicating use or anticipated use followed by standard error of measurement.2014 NBCEC Brown Bagger

Genetic Improvement ConceptsGauge knowledge of and understanding of basic genetics/selection concepts and attitudes Asked to identify current and anticipated selection behaviors Stakeholder Survey Results 2014 NBCEC Brown Bagger

Producers lack basic understanding of new genomic based selection tools and anticipated benefits62% didn’t know what class of traits would benefit from marker assisted selection13.1% correct (difficult/expensive; sig. costs/returns) >2/3 didn’t know value of including genomics in NCE 20.8% correctly ID’d increase in acc.70% didn’t know how much genetic variationaccounted for by current DNA markersStakeholder Survey Results2014 NBCEC Brown Bagger

Genetic Improvement Concepts41.7% ADG as selection criteria to improve FE27% cow mature weight and body condition score<4% ME EPD<4% Residual Average Daily Gain ( rADG ) <4% selection index that use FI predictionsStakeholder Survey Results2014 NBCEC Brown Bagger

Willingness to pay for bulls with reliable FE genetic predictions23% would not pay more10.5% increase price US$ 101-20011.8% increase price US$ 201-30013.6% pay > US$ 500 Stakeholder Survey Results 2014 NBCEC Brown Bagger

Cow-calf producers not well versed in either feed efficiency or genetic/selection concepts.More work to be done to educate trainers and producers on both topicsNo direct price signal in value chain, although significant cost saving/value improvement through improvementValue of demonstration project; surveyed participants to quantify knowledge gain/attitudes Stakeholder Survey Conclusions2014 NBCEC Brown Bagger

US Consortium for Genetic Improvement of Feed Efficiency in Beef Cattlewww.beefefficiency.org Acknowledgements This project is supported by Agriculture and Food Research Initiative Competitive Grant no. 2011-68004-30214 from the USDA National Institute of Food and Agriculture 2014 NBCEC Brown Bagger

Thank you!Questions? www.beefefficiency.org 2014 NBCEC Brown Bagger