PDF-ariance and standard deviation grouped data Introduction In this leaet we extend the denitions of variance and standard deviation to data which has been grouped
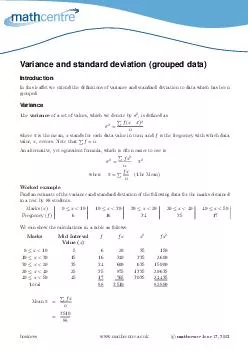
ariance The ariance of a set of values which we denote by i de64257ned as where is the mean stands for each data value in turn and is the frequency with which data
Download Presentation
"ariance and standard deviation grouped data Introduction In " is the property of its rightful owner. Permission is granted to download and print materials on this website for personal, non-commercial use only, provided you retain all copyright notices. By downloading content from our website, you accept the terms of this agreement.
Presentation Transcript
Transcript not available.