PPT-Drawing Pie Charts
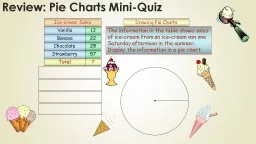
Total Vanilla Banana Chocolate Strawberry 13 22 28 57 Icecream Sales The information in the table shows sales of icecream from an icecream van one Saturday afternoon
Download Presentation
"Drawing Pie Charts" is the property of its rightful owner. Permission is granted to download and print materials on this website for personal, non-commercial use only, provided you retain all copyright notices. By downloading content from our website, you accept the terms of this agreement.
Presentation Transcript
Transcript not available.