/
FIU Solar House’s Potential Performance: A Study of Natur FIU Solar House’s Potential Performance: A Study of Natur

FIU Solar House’s Potential Performance: A Study of Natur - PowerPoint Presentation

jane-oiler
jane-oiler . @jane-oiler
Follow
422 views
Uploaded On 2016-03-15

FIU Solar House’s Potential Performance: A Study of Natur - PPT Presentation

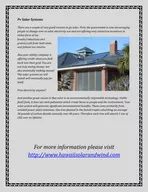
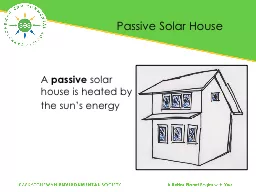
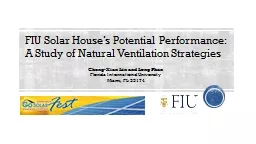
ChengXian Lin and Long Phan Florida International University Miami FL 33174 FIU at us Solar decathlon 2005 1 10 Contests Architecture Dwelling Documentation Communications Comfort Zone ID: 256968

house solar energy fiu solar house fiu energy model natural ventilation thermal decathlon www hybrid amp solardecathlon systems comparison

Share:

Link:

Embed:

Download Presentation from below link

Download Presentation The PPT/PDF document "FIU Solar House’s Potential Performanc..." is the property of its rightful owner. Permission is granted to download and print the materials on this web site for personal, non-commercial use only, and to display it on your personal computer provided you do not modify the materials and that you retain all copyright notices contained in the materials. By downloading content from our website, you accept the terms of this agreement.


Presentation Transcript

Slide1

FIU Solar House’s Potential Performance: A Study of Natural Ventilation Strategies

Cheng-Xian Lin and Long Phan

Florida International University

Miami, FL 33174Slide2

FIU at u.s. Solar decathlon 2005

1

10 ContestsArchitecture

Dwelling

Documentation

Communications

Comfort ZoneAppliancesHot WaterLightingEnergy Balance1Getting Around

Modular

c

onstruction

The

h

ouse

e

xhibition

FIU Solar House’s demonstration

An overview of the house

All credits to DOE Solar Decathlon (

www.solardecathlon.gov

) & FIU solardecathlon (http://gsl.eng.fiu.edu/webs/SOLAR2004/)

At a glance

Name:

Engawa

Constructed by modules

1/3 glass

PV-integrated windows (projection surface)

Overall standing 13/18Slide3

FIU at u.s. solar decathlon 2011

10 ContestsArchitecture

Market AppealEngineering

Communications

Affordability

Comfort Zone

Hot WaterAppliancesEntertainmentEnergy Balance1

Overview of the house model

All credits to DOE Solar Decathlon (

www.solardecathlon.gov

) & FIU solardecathlon (

www.solardecathlon.fiu.edu

)

Visitors at the exhibition in Washington D.C.

Rooftop solar panels

Aerial view

Top view of the house model

Exterior & interior

2

At a glance

Name:

perFORM[D]ance

Modular design

Open pavillion

Operable louvers/shade

Overall standing: 11/22Slide4

Fiu at solar decathlon china 2013

All credits to Solar Decathlon

China (

http://www.sdchina.org

/

) &

FIU-Tsinghua team(

http://www.thfisdc.com

/

)

Interior

3

Overview of the house model

Rooftop solar panels

3

10 Contests

Architecture

Market Appeal

Engineering

CommunicationsSolar Application3

Comfort Zone

1

Hot Water

1

Appliances

Entertainment

Energy Balance

1

At a glance

Name:

O-house

Modular house

PV louvers

Traditional courtyard

Overall standing: 5/22Slide5

CURRENT activities in solar house 2005

Public Exhibition and Educational Activities

Outreach: Annual Engineering Expo, Engineers on Wheel Visiting by students: undergraduate and K-12Lab toursStudent Projects

Senior design projects

C

ourse projects

Exchange student studies Elise Belleil, EI. CESI, France, Summer 2013Francisco Zevallos, Loughborough/Northumbria University, UK, Fall 2013Research ProjectsReal time temperature and humidity monitoring PV/T technology demonstrationBuilding energy simulation model validation4Slide6

The study of the 2005 solar house modelStudents: Elise

Belleil and Long Phan

The Solar House Model

34’4” x 25’4” x 15’4”

7 typical residential spaces

Total conditioned area 721.15 ft

2Window-to-wall ratio is 45.8 %Rooftop PV panels with tilted angle of 75

o

5

Floor plan of the houseSlide7

Motivations

The benefits of natural ventilation strategiesThe limitations and remedies of energy utilization in hot and humid climatesThe aid

of building energy simulation program providing insights for different strategies

Comparisons of a few natural ventilation strategies to

seek the

most possible solution in terms of thermal comfort and energy reduction

Objectives 7Slide8

Physical model


Total

North

East

South

West

Gross Wall Area (ft

2

)

1682

500.41

449.18

283.09

449.18

Window Opening Area (ft

2)

764.99

360.59

202.25

0

202.25

Gross Window-Wall Ratio (%)

45.48

72.06

45.03

0.00

45.03

Room Type

Area (ft

2

)

Volume (ft

3

)

Conditioned (Y/N)

Electrical Load (W)

Lighting Load (W/ft

2

)

Dining room

120.56

1,297.11

Y

0

1.8

Living room

135.63

1,869.21

Y

1,050

1.8

Bedroom

135.63

1,869.21

Y

840

1.8

Bathroom

78.79

718.30

Y

5,340

1.8

Study room

88.48

986.34

Y

60

1.8

Kitchen

162.43

1,655.90

Y

8,964

1.8

Battery room

19.48

407.53N--Mechanical room30.10N--

8

Typical rooms of the solar house

The 2005 solar house model

Wall and window areas in different surfacesSlide9

Building Energy simulation model


Energy Balance Equation for a room model

Net Zone Load

System Load Equation

9

Simulation Code:

EnergyPlusSlide10

Boundary conditions & materials


Int. Door

Ext. Door

Ext. Windows

Roof

Floor

Ext. Wall

Int. Wall

Layer 1

Wood


Metal surface

Clear glass


Plywood


Metal surface

Cellular Polyisocyanurate - Gas permeable facers

Gypsum board

Layer 2


Insulation board

Air resistance


Polystyrene

(Extruded)

Polystyrene

(Extruded)

Steel frame

Steel frame

Layer 3


Clear glass


Steel frame

Polystyrene

(Molded beads)

Polystyrene

(Molded beads)

Polystyrene

(Molded beads)

Layer 4


Polystyrene

(Molded beads)

Steel frame

Gypsum board

Gypsum board

Layer 5


Gypsum board

Plywood


Miami, FL climate graph

10Slide11

Natural ventilation methods

(a)

(b)

(c)

Natural ventilation methods

Thermal chimney (TC)

Earth tube (ET)

Cool tower (CT)Opening

11

(d)Slide12

Single method results

(a) Annual energy consumption

(b) Total uncomfortable days

Comparison among various natural ventilation systems

12Slide13

Hybrid method results

Comparison among various hybrid cooling systems

(a) Annual energy consumption

(b) Total uncomfortable days

Hybrid system schedule

13Slide14

Systems comparison

Comparison among all cooling systems

14Slide15

Thermal zones comparison

15

Temperature profile of 7 thermal zones at different cooling strategiesSlide16

conclusionVarious natural ventilation

strategies including earth tube, thermal chimney, wind tower, and opening, as well as hybrid strategies are investigated.

Relying on only natural ventilation could cause a dramatic impact to the human thermal comfort.Hybrid systems have revealed the significant reduction in cooling energy consumption while complying with the minimum requirements for thermal comfort recommended by ASHRAE

standards.

Combined thermal chimney and mechanical system (HVAC) method shows relatively better potentials for hot and humid climate such as Miami.

16Slide17

THANK YOU !