/
IMF Country Report No. 14/8  In the context of the arrangement under t IMF Country Report No. 14/8  In the context of the arrangement under t

IMF Country Report No. 14/8 In the context of the arrangement under t - PDF document

jane-oiler
jane-oiler . @jane-oiler
Follow
453 views
Uploaded On 2015-09-27

IMF Country Report No. 14/8 In the context of the arrangement under t - PPT Presentation

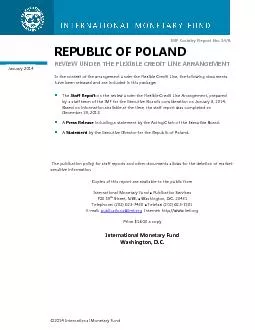
Internet httpwwwimforg Price 1800 a copy International Monetary Fund Washington DC January 2014 REPUBLIC OF POLAND REVIEW UNDER THE FLEXIBLE CREDIT LINE ARRANGEMENT KEY ISSUES Backgrou ID: 141951

Internet: http://www.imf.org Price:

Share:

Link:

Embed:

Download Presentation from below link

Download Pdf The PPT/PDF document "IMF Country Report No. 14/8 In the cont..." is the property of its rightful owner. Permission is granted to download and print the materials on this web site for personal, non-commercial use only, and to display it on your personal computer provided you do not modify the materials and that you retain all copyright notices contained in the materials. By downloading content from our website, you accept the terms of this agreement.


Presentation Transcript

IMF Country Report No. 14/8 In the context of the arrangement under the Flexible Credit Line, the following documents have been released and are included in this package:on the review under the Flexible Credit Line Arrangement, prepared by a staff team of the IMF for the ExecutBased on information available at the time, the staff report was completed on December 19, 2013. including a statement by the Acting Chair of the Executive Board. by the Executive Director for the Republic of Poland. The publication policy for staff reports and other documents allows for the deletion of market-Copies of this report are available to the public from International Monetary Fund Publication Services 700 19 Street, N.W. Washington, D.C. 20431 Telephone: (202) 623-7430 Telefax: (202) 623-7201 Internet: http://www.imf.org Price: $18.00 a copy International Monetary Fund Washington, D.C. January 2014 REPUBLIC OF POLAND REVIEW UNDER THE FLEXIBLE CREDIT LINE ARRANGEMENT KEY ISSUES Background December 19, 2013 PUBLIC OF POLAND ��REPUBLIC OF POLAND INTERNATIONAL MONETARY FUND Approved By Mahmood Pradhan and Vivek Arora This report was prepared by a staff team led by Julie Kozack and comprising Lone Christiansen, Christian Ebeke, Francisco Vazquez (all EUR), and Annet te Kyobe (SPR). Excellent assistance was provided by Gillian Adu and Bartek Augustyniak (both EUR). CONTENTS CONTEXT_________________________________________________________________________________________RECENT ECONOMIC AND POLICY DEVELOPMENTS ___________________________________________A. A Recovery is Underway ________________________________________________________________________B. Macroeconomic Management has been Appropriate __________________________________________RISKS _____________________________________________________________________________________________FCL QUALIFICATION CRITERIA ________________________________________________________________SAFEGUARD ASSESSMENT ____________________________________________________________________STAFF APPRAISSAL ____________________________________________________________________________BOX 1. Changes to Poland’s Second Pension Pillar_____________________________________________________FIGURES 1. Recent Economic Developments, 2009____________________________________________________2. Balance of Payments Developments, 2009_________________________________________________3. Financial Market Developments, 2007_____________________________________________________4. Banking Sector Developments, 2005_______________________________________________________5. Banking Credit Growth and Funding, 2007________________________________________________6. Reserve Coverage in International Perspective, 2012 __________________________________________7. Qualification Criteria, 2009_________________________________________________________________ TABLES 1. Selected Economic Indicators, 2011_______________________________________________________2. Balance of Payments on Transaction Basis, 2011__________________________________________3. Monetary Accounts (eop), 2007___________________________________________________________4. Financial Soundness Indicators, 2007______________________________________________________5. General Government Statement of Operations, 2011______________________________________6. General Government Financial Balance Sheet, 2011_______________________________________7. External Financing Requirements and Sources, 2009______________________________________8. Capacity to Repay the Fund, 2014_________________________________________________________ ��REPUBLIC OF POLAND INTERNATIONAL MONETARY FUND ANNEXES I. External Debt Sustainability Analy___________________________________________________________II. Public Sector Debt Sustainability Analysis _____________________________________________________ ��REPUBLIC OF POLAND INTERNATIONAL MONETARY FUND CONTEXT 1. The Polish economy has been resilient in the face of substantial shockshelped by very strong fundamentals, a robust policy framework that supported forceful policy responses, and insurance provided by the FCL arrangement. Poland was the only EU country to avoid recession during the 200809 global financial crisis. This resilience was anchored on healthy household and corporate balance sheets, a sound banking sector, and decisive countercyclical fiscal and monetary policy. But, as growth weakened in Poland’s main trading partners as a result of the euro area crisis, heightened uncertainty weighed on household consumption and firms’ hiring and investment decisions. As a result, growth slowed substantially in 2012 and is expected to be lower in 2013 than in 2009. The authorities took action to ameliorate the effects of adverse external shocks on the economy through flexible macroeconomic management: policy interest rates were cut substantially and automatic fiscal stabilizers were allowed to operate. Meanwhile, effective financial sector policies continued to enhance the resilience of the banking system. 2. Nevertheless, Poland’s substantial linkages with core euro area countries and global financial markets continue to make it susceptible to external shocks. About 70 percent of Poland’s domestic value added is exported to, and finally consumed in, Europe. Poland’s key role in supply chain linkages with Germany represents one of the main channels of exposure to core euro area countries and the rest of the world. Sizable FDI inflows also originate predominantly from Europe, and European banks’ presence in the Pol banking system is significant. Poland is highly integrated with international capital markets through relatively large participation of foreign investors in the domestic government bond market (the foreign share is about 34 percent), sizable gross external financing needs (estimated at around 21 percent of GDP in 2014), and Poland’s role as proxy for investors seeking exposure to the CEE region. This exposes Poland to more generalized shifts in investor sentiment, including on account of turbulence in global financial markets or shifts in risk appetite for emerging market assetsincluding those stemming from eventual U.S. monetary policy normalization. 3. Sustained precautionary access to the FCL has supported the authorities’ macroeconomic framework and provided an additional buffer against external risks. The Fund has supported the authorities’ policies with four successive FCL arrangements. The initial FCL arrangement was approved in May 2009 for an amount of SDR 13.7 billion (1000 percent of quota). A successor arrangement of the same amount was approved in July 2010. In January 2011, a new two-year arrangement was approved with access increased to SDR 19.2 billion (1400 percent of quota) on account of heightened external risks. The current two-year arrangement, approved in nuary 2013, provides access of SDR 22 billion (1303 percent of quota). The authorities stressed that the FCL arrangements have helped preserve favorable access to capital markets, facilitating a more flexible policy response. Staff analysis indicates that the FCL arrangement has helped reduce the volatility of local-currency government bond yields, particularly during periods of high stress in global financial markets. ��REPUBLIC OF POLAND INTERNATIONAL MONETARY FUND RECENT ECONOMIC AND POLICY DEVELOPMENTS A. A Recovery is Underway 4. The economy is starting to recover after a cyclical slowdownDomestic demand was sluggish in the first half of 2013 (reflecting very weak investment and inventory destockingwith net exports driving growth (Figure 1, Table 1). An improvement in economic activity in main trading partners, particularly Germany, provided support for an incipient rebound that started in mid-More recently, household consumption has started to gain traction, underpinned by improving confidence and rising real wages (as nominal wage growth has outpaced inflation). High-frequency data also point to a recovery in retail sales and industrial production, and a moderation the decline in construction activity. 5. The labor market has improved somewhat (but is still weak) and inflation remains subduedIn the third quarter, labor market conditions continued to improve with the (seasonally adjusted) jobless rate dropping to 10.2 percent from a high of 10.6 percent in the first quarter. Real wage growth has accelerated modestly, supported by low inflation. Price pressures and inflation expectations have been muted. While CPI inflation rose from its record low 0.2 percent (yoy) in June, inflation in October (0.8 percent, yoy) remains well below the 2½ percent target. Core inflation has also remained subdued. 6. The current account deficit narrowed sharply in the first half of 2013, led by an improvement in the trade balancestrong pick-in export growth was supported by improving activity in main trading partners and gradual but continuous expansion toward Eastern European markets. In contrast, import growth was affected by weak domestic demandleading to an unprecedented trade surplus. Net external liabilities, which include substantial cross-border intra-company loans, have stabilized at around 68 percent of GDP (Figure 2, Table 27. The economy continues to face a volatile external environmentThe emerging market sell-off that took place over the summer affected Poland less than many other emerging economies (Table 3)The floating exchange rate regime played a stabilizing role, while broadly adequate international reserves and the precautionary FCL arrangement boosted market confidence. Nonetheless, cumulative capital outflows of about $2.9 billion were registered between June and September. Foreign investors reduced their holdings of local government bonds by about 40 45 50 55 60 0 2 4 6 8 10 12 2008 2009 2010 2011 2012 2013 Activity Indicators Unemployment rate (sa, percent) PMI, manufacturing (RHS) PMI: 50+ = expansion Sources: HSBC/MKT, Eurostat, and IMF staff calculations. ��REPUBLIC OF POLAND INTERNATIONAL MONETARY FUND $2.8 billion (a 1.7 percentage point drop in their holdings to 34 percent). Yields on 10-year local government bonds increased by 100 bps (in line with the increase in long-term US treasury yields) from the very low levels achieved in early May, but they nonetheless remain low by historical standards (Figure 3). More recently, capital outflows continued at a more moderate pace, but the equity market has performed well (surpassing its spring 2011 level)8. The banking system has remained profitable and well-capitalized (Figure 4, Table 4). Average capital to risk-weighted assets increased further to 15.7 percent in the third quarter (with tier 1 capital at 14.2 percent of risk-weighted assets), helped by retained earnings. Profitability has held up well, despite some compression in net interest margins associated with the drop in policy ratesOverall zloty liquidity in the banking system has remained ample and the gradual withdrawal of foreign funding that started in mid-2011 has stoppedCredit growth has remained weak, particularly with respect to non-financial corporations, but is starting to recover in the household segment (Figure 5). New foreign currency mortgage lending has effectively come to a halt. The impaired loan ratio declined slightly to 8½ percent at end-September from close to 9 percent months earlierhelped by a drop in impaired consumer loans. But, the stock of impaired consumer and small and medium-sized enterprise loanremains high (at around 15 percent for both). B. Macroeconomic Management has been Appropriate 9. In the context of a difficult external environment and weak growth, the authorities have carefully managed macroeconomic policies. The policy mix has appropriately combined supportive monetary policy with the use of automatic fiscal stabilizers around a consolidation pathThis has helped pave the way for the recovery that is now underway, which is essential for further rebuilding policy buffers and preparing for aexit from the FCL arrangement once external risks recede. 10. Substantial monetary easing since end-2012 has provided support to the economyMonetary Policy Council (MPC) completed an easing cycle that delivered 225 bps of rate cuts between November 2012 and July 2013. The MPC has expressed its intention to keep policy rates on hold at the current 2.5 percent until at least mid-2014. Maintaining an accommodative stance should be facilitated by the new Monetary Policy Guidelines, which allow the MPC to accept longer periods of deviation of inflation from the target range of 1½3½ percent. Work is also underway to strengthen the MPC, including by possibly introducing staggered terms for MPC members. 11. The flexible exchange rate played its stabilizing role, notably during the recent episode of turmoil in emerging marketsDespite significant monetary easing, the zloty remained relatively stable throughout the summer. This likely reflected confidence in Poland’s policy framework. International reserves remain broadly adequate based on standard metrics of reserve adequacy (Figure 6)Updated estimates for Poland, using EBA methodologies based on data available as of November 2013, suggest that the exchange rate is broadly consistent with medium-term fundamentals and appropriate policies, with the current account deficit close to its norm and ��REPUBLIC OF POLAND INTERNATIONAL MONETARY FUND the real effective exchange rate (REER) close to the model estimate. Aside from the insurance provided by the FCL and broadly adequate international reserves, the NBP also has a swap line with the Swiss National Bank to help cover liquidity needs in the event of major Swiss franc funding pressures associated with foreign currency mortgages. 12. Fiscal policy is rightly balancing the need to avoid being a drag on growth with furtheconsolidation (Tables 5 and 6).In 2013, automatic stabilizers were appropriately allowed to operate in response to the cyclical slowdown. Preliminary staff estimates suggest that the fiscal deficit would widen by ¾ percent of GDP to about 4.6 percent of GDP in 2013, mainly reflecting the impact of the economic slowdown on tax collections (notably VAT). As a result, the public debt ratio is expected to increase (after declining in 2012). Sound public debt management allowed the government to cover all 20financing needs by October, and pre-financing of 2014 needs is underway. For 2014, the fiscal deficit is expected to decline to 3.6 percent of GDP, which is appropriate at this stage of the recoveryThe fiscal improvement reflects consolidation measures of about percent of GDP, some cyclical recovery in revenue, and changes to the pension system’s second pillar (Box 1). The latter are expected to lead to a drop in public debt by about 9 percent of GDP and a decline in the deficit by about ½ percent of GDP in 2014 (the improvement in the deficit will rise to 1 percent of GDP in 2015), with a corresponding increase in future pension liabilities. To help entrench fiscal consolidation, the authorities introduced a permanent fiscal rule that constrains the growth of public expenditure, while allowing for countercyclical fiscal policy. In particular, the rule caps the growth of public expenditure at trend GDP growth (or below trend GDP growth under certain conditions, including if public debt surpasses pre-fined thresholds). 13. Additional steps were taken to further strengthen the resilience of the financial sectorFollowing the incorporation of credit unions into the bank supervisory perimeter, the authorities implemented a series of audits and rehabilitation measures to strengthen this small, but nonetheless important, segment. Banking supervision was further reinforced by increasing the frequency of targeted inspections and enhancing the coordination between onsite and offsite work. In line with FSAP recommendations, the financial supervisory authority (KNF) has also engaged in a thematic review of banks’ credit risk policies as part of its efforts to address impaired loans. In parallel, work has continued on the establishment of a systemic risk board (SRB)essential for establishing a macroprudential frameworkand on legislation to overhaul the bank resolution framework. ��REPUBLIC OF POLAND INTERNATIONAL MONETARY FUND Box 1. Changes to Poland’s Second Pension Pillar Poland currently has a three pillar pension system: (i) the first pillar is mandatory, pay as you go, notional defined contribution, and public; (ii) the second pillar is mandatory, funded, and privately managed; and (iii) the third pillar is voluntary, funded, and barely used. The s econd pillar is funded by diverting a portion of social contributions collected by the general government to the privately managed pension funds. Assets in the second pillar currently amount to about 18 percent of GDP half of which is represented by holdin gs of governme nt securities and government - guaranteed debt . In September, the Polish authorities announced significant changes to the second pillar. The changes which will begin to take effect in 2014 are as follows: Private pension funds’ holdings of Trea sury bonds and Treasury - guarantee d bonds will be transferred to the social security administration and cancelled; Corresponding pension fund liabilities will be transferred to individual notional accounts in the first pillar and thereafter indexed by the f ive - year average nominal GDP growth; All new pension contributions will be channeled to the social security administration, unless contributors ” opt in” to the second pillar; Pension funds will be banned from investing in government bonds, and current benc hmarking and penalty systems will be removed to encourage more active portfolio management; Limits on holdings of foreign securities will be lifted over time, from the current 5 percent of pension funds’ portfolios to 30 percent by 2016; 1 and Pension payou ts will be centralized in the public system, with a gradual transfer of assets to the first pillar starting ten years before retirement. The proposed changes were passed by p arliament in early December . The law is likely to be challenged in Poland’s Consti tutional Court (but would still be implemented in the meantime) . Notwithstanding these changes to the pension system, additional steps will still be needed to reform the social security system and put the public debt ratio on a downward path. I mproving the financial strength of the social security system will require further reforms of the special occupational pensions and better alignment of disability and survivor pensions with the core pension system ; Despite the near - term fiscal gains from the proposed changes to the pension system, it is essential that fiscal policy remains prudent and that public debt is reduced further over time ; As the planned changes to the pension system are implemented, careful attention will need to be paid to potential implicati ons for the government bond and equity markets ; and Given the expected decline of replacement rates under the defined - contribution system, additional voluntary pension savings would help reduce the risk of old age poverty. ____________ ____________________ ________ 1 The current 5 percent limit is non - binding, as foreign securities constitute about 1½ percent of pension fund assets. Staff calculations indicate that the lifting of the ceiling on foreign securities’ holdings is not likely to have a destabili zi ng effect on the balance of payments, as portfolio outflows would likely represent less than 1 percent of GDP per year. ��REPUBLIC OF POLAND INTERNATIONAL MONETARY FUND RISKS 14. Risks to the outlook remain dominated by external factors. The economy has substantial trade and financial linkages with core euro area countries, including through supply chains and foreign bank ownership. This makes Poland susceptible to spillovers stemming from a protracted period of low growth in Western Europe, or a re-emergence of financial stress in the euro areaUnsettled global financial conditions higher-than-expected increases in long-term rates as advanced countries exit unconventional monetary policy would affect Poland through financial market volatility and capital outflows. The banking system also remains exposed to foreign currency-induced credit and liquidity risks, and to contagion from potential distress in their parentsConversely, on the upside, domestic demand could recover more quickly than projected as confidence returns, boosting growth by more than currently expected. 15. The authorities continue to view the FCL arrangement as an effective insurance against external downside risks. They underscored the usefulness of the FCL arrangement as a temporary complement to reserves and a signal of Poland’s very strong policy frameworks, institutions, and track record of policy implementation. The authorities consider that external risks remain elevatednotably with respect to the possibility of a prolonged period of weak growth in Europe financial volatility facing emerging markets16. The authorities remain committed to exiting from the FCL arrangement when external conditions allowThey reaffirmed their commitment to maintaining very strong policies and underscored their intention to rebuild policy space to counter adverse shocks, notably through ongoing fiscal consolidation at a pace consistent with the economic cycle, an appropriate monetary policy stance, and continued vigilance regarding the state of the banking system. At the same time, given the rly phase of the economic recovery and heightened external risks, the authorities believe that the FCL provides importa”breathing space” for Poland to continue to buffers at a pace consistent with economic and financial conditions (Tables 7 and 8). They consider that these steps are sufficient help prepare for an exit from the FCL arrangement when external conditions allow. 0.0 0.2 0.4 0.6 0.8 1.0 with euro area with Germany 2000 07 2008 13 Poland's Business Cycle Synchronization (Correlation coefficient) Source: IMF staff calculations. Correlation coefficients of quarterly year--year GDP growth rates 2 4 6 8 0 10 20 30 40 2005 2007 2009 2011 2013 Foreign ownership share of local currency gov. bonds 10 - year gov. bond yield (RHS) Foreign Ownership of Polish Government Bonds (Percent) Sources: Datastream, Haver Analytics, and IMF staff calculations. ��REPUBLIC OF POLAND INTERNATIONAL MONETARY FUND FCL QUALIFICATION CRITERIA 17. In staff’s view, Poland continues to fully meet the qualification criteria for an arrangement under the FCL. Very strong policy frameworks have allowed the authorities to effectively adjust policies, as needed, in response to adverse external shocks and economic developmentsMonetary policy is conducted within the context of the well-establisheinflation targeting framework. Fiscal policies remain guided by the medium-term objective of achieving fiscal deficit of 1 percent of GDP in structural terms, which staff deems appropriate to ensure fiscal sustainabilityThe financial supervisory framework continues to enhance the resilience of the banking system, including by promoting strong capitalization. The authorities remain committed to maintaining strong policies going forward and taking appropriate actions should downside risks materialize. The Executive Board commended Poland’s policy track record at the conclusion of the 2013 Article IV consultation. As to the relevant criteria for the purpose of assessing qualification under the FCL arrangement, identified in ¶2 of the FCL decision, staff’s assessment is as follows (Figure 7): The external position is sustainable. External debt, though relatively high at 74 percent of GDP at end-, expected to decline. The updated external debt sustainability analysis (Annex Isuggests that external debt ratios will decline over the medium term and remain manageable under adverse shocks. The current account deficit has narrowed to 2.7 percent of GDP and is projected to rise to 3.5 percent of GDP in the medium term. The capital account is dominated by private flowsThe bulk of capital flows to Poland originates from the private sector, with official creditors accounting for less than 5½ percent of external debt in 2013. Uninterrupted access to capital markets at favorable terms. Poland has maintained one of the highest credit ratings among emerging market countries and constant access to international capital markets at favorable terms. In 2013, the government successfully issued about €2 billion of sovereign debt in international capital markets, including a 20-year bond. Spreads vis-à-vis German bonds have remained narrow and stable (reaching a minimum of bps on 10-year bonds in mid-May 2013) and, despite the recent increaseyields on government bonds remain low by historical standards. Reserves are relatively comfortableGross international reserves stood at $106 billion at end-October and are broadly adequate relative to standard reserve metrics. They have declined slightly since the current FCL arrangement was approved, largely reflecting shifts in government foreign currency deposits. Sound public finances, including a sustainable public debt position. Fiscal policy is underpinned by Poland’s strong policy framework, which will be reinforced by the implementation of the new fiscal rule. To a large extent, the widening fiscal deficit in 2013 was cyclical in nature: the structural deficit still dropped by about ½ percent of GDP to 3½ percent ��REPUBLIC OF POLAND INTERNATIONAL MONETARY FUND of GDP and, under current policies, is projected to reach about 2 percent of GDP by 2016. Public debt should drop below 50 percent of GDP in 2014 further to about 47percent of GDP by 2018. Debt sustainability analysis, conducted under the new framework for market-access countries, indicates that the baseline fiscal path is consistent with sustainable debt under a variety of macroeconomic scenarios (Annex II). The analysis also suggests that risks stemming from the currency composition and duration profile of public debt are limited, reflecting the authorities’ strong debt management strategyLow and stable inflation, in the context of a sound monetary and exchange rate policy frameworkBoth headline and core inflation remain low (and the former is below its target), but are expected to rise as the economy recovers. The authorities remain committed to preserving their credible and transparent inflation-targeting frameworkThe absence of bank-solvency problems that pose an immediate threat of a systemic banking crisis. Poland’s banking system continues to be liquid, well capitalized, and profitable. The 2013 FSAP Update concluded that the banking system is resilient to a variety of large but plausible adverse shocks without threatening financial stability. However, the large presence of foreign banks headquartered in the EU continues to pose a source of risk and a channel for the transmission of external shocks to domestic credit marketsEffective financial sector supervisionFSAP Update concluded that Poland’s banking system appears to be resilient. It found that Poland is broadly compliant with Basel Core Principles for effective Banking Supervision (BCP), Insurance Core Principles (ICP), and International Association of Deposit Insurers (IADI). The observed resilience of the banking sector is backed by a proactive supervisory approach to limiting risks related to consumer and foreign currency lending, and by a conservative stance on credit risk policies and capital buffers. ta integrity and transparencyThe overall quality of Poland's macroeconomic data remains good, consistent with the findings of the 2003 data ROSC, and Poland remains in observance of the Special Data Dissemination Standard (SDDS). Concerns about the large errors and omissions in the balance of payment have been addressed with the support of Fund Technical Assistance (TA) and stood at 0.6 percent of GDP in 2012 (down from 4 percent of GDP prior to Fund TA). SAFEGUARD ASSESSMENT 18. Staff has completed the safeguard procedures for Poland’s 2013 FCL arrangement. The authorities provided the necessary authorization for Fund staff to communicate directly with the NBP's external auditor, PricewaterhouseCoopers (PwC) Warsaw. PwC issued an unqualified audit opinion on the NBP’s 2012 financial statements on March 28, 2013. Staff reviewed the 2012 audit results and discussed these with PwC. No significant safeguards issues emerged from the conduct of these procedures. ��REPUBLIC OF POLAND INTERNATIONAL MONETARY FUND STAFF APPRAISSAL 19. Poland continues to benefit from the FCL arrangement. The FCL has helped sustain access to global capital markets and bolster confidence in the country’s fundamentals and polices. It has also provided Poland with additional flexibility in the implementation of sound macroeconomic policies, helping to ameliorate the effects of adverse external shocksPoland’s macro-financial stability is likely to bring positive externalities to the CEE region, as validated by its recent inclusion in the Fund’s list of countries with systemically important financial sectors. 20. Poland continues to meet the qualification criteria for access to FCL resources. The authorities have continued to implement very strong policies and remain committed to respond appropriately to actual or potential balance of payments difficulties. Therefore, staff recommends completion of the review under the FCL arrangement for Poland. ��REPUBLIC OF POLAND INTERNATIONAL MONETARY FUND Figure 1. Poland: Recent Economic Developments, 2009 13 Sources: Haver, Central Statistical Office, and IMF staff calculations. - 6 - 4 - 2 0 2 4 6 8 2009 2010 2011 2012 2013 Contributions to GDP Growth (Percentage points) Consumption Fixed investment Net exports Inventory GDP growth 90 95 100 105 110 115 - 20 - 10 0 10 20 30 2009 2010 2011 2012 2013 Trade Volume (Year - on - year percent change) Exchange Rate (2000 = 100) Exports Imports Nominal effective rate (RHS) - 40 - 35 - 30 - 25 - 20 - 15 - 10 - 5 - 5 0 5 10 15 20 2009 2010 2011 2012 2013 Retail Sales (Year - on - year percent change) Consumer Confidence (Percent balance) Retail sales Confidence (RHS) - 20 - 15 - 10 - 5 0 5 10 15 2009 2010 2011 2012 2013 Industrial Production (YoY percent change) Business Sentiment Indicator (Percent balance) IP Manufacturing sentiment 0 1 2 3 4 5 6 2009 2010 2011 2012 2013 CPI Inflation (Year - on - year percent change) Headline Core Target (with +/ - 1pp tolerance band) 0 1 2 3 4 5 6 7 8 - 3 - 2 - 1 0 1 2 3 4 5 6 2009 2010 2011 2012 2013 Private Sector Employment and Wages (Year - on - year percent change) Employment Nominal wages (3mma, RHS) GDP growth accelerated in the third quarter, lifted by net exports and a nascent rebound in domestic demand. Export growth strengthened, helped by a competitive exchange rate. Imports recovered along with domestic demand. Consumer confidence has recovered and retail sales growth has picked up. Business sentiment also improved recently and industrial production expanded modestly. Headline CPI and core inflation are firmly below target. In the enterprise sector, wages have accelerated modestly, while the decline in employment is decelerating. ��REPUBLIC OF POLAND INTERNATIONAL MONETARY FUND Figure 2. Poland: Balance of Payments Developments, 2009 13 Sources: National Bank of Poland and IMF staff calculations. 1/ Excludes NBP. - 12 - 10 - 8 - 6 - 4 - 2 0 2 4 6 2009 2010 2011 2012 2013 Current Account Balance (Percent of GDP, four - quarter rolling sum) Transfers Income Services Goods Current account 0 1 2 3 4 5 6 7 8 9 2009 2010 2011 2012 2013 Capital transfers, net FDI, net Current account deficit Current Account Deficit, Capital Transfers, and FDI (Percent of GDP, four - quarter rolling sum) - 1 0 1 2 3 4 2009 2010 2011 2012 2013 Portfolio Flows, Net (Billions of US dollars, 3 - month moving average) - 100 - 75 - 50 - 25 0 25 50 75 100 125 150 2009 2010 2011 2012 2013 International Investment Position 1/ (Percent of GDP) Net Assets Liabilities 0 100 200 300 400 500 600 700 2009 2010 2011 2012 2013 International Investment Position, Liabilities (Billions of US dollars) Other sectors General government Banks The current account deficit has narrowed since Q2 2011... ...and the composition of its financing has remained sound. However, financial inflows have weakened... ... and net portfolio flows have turned negative. The IIP has levelled off at a large net liability position... ...and liabilities in both bank and non - bank private sectors have stabilized. - 6 - 4 - 2 0 2 4 6 8 10 12 2009 2010 2011 2012 2013 Financial Account Balance (net flows) (Percent of GDP, four quarter rolling sum) Other investments Portfolio FDI Financial account CA deficit ��REPUBLIC OF POLAND INTERNATIONAL MONETARY FUND Figure 3. Poland: Financial Market Developments, 2007 13 Sources: Bloomberg, Haver Analytics, Polish Ministry of Finance, and IMF staff calculations. 80 85 90 95 100 105 110 115 2009 2010 2011 2012 2013 Exchange Rate: National Currency versus Euro (Jan. 1, 2009 = 100) Hungary Poland Czech Rep. 0 5 10 15 20 25 30 35 2009 2010 2011 2012 2013 Hungary Poland Czech Rep. Implied Volatility of Exchange Rate vs. Euro (1 - month options contract, percent) 0 200 400 600 800 1000 2009 2010 2011 2012 2013 Hungary Poland J.P. Morgan Euro EMBI Spread (Basis points) The zloty has remained relatively stable despite recent turbulence in emerging economies ... 0 2 4 6 8 10 12 14 16 2009 2010 2011 2012 2013 5 - Year Government Bond Yield (Percent) Hungary Poland Czech Rep. 0 100 200 300 400 500 600 700 800 2009 2010 2011 2012 2013 Credit Default Swaps Spreads (Basis points) Hungary Poland Czech Rep. After trending downward, yields on Polish government bonds have increased ... ... but EMBI spreads remain low. CDS spreads have stabilized below 100 basis points... ...and stock market values are close to their pre - crisis levels, though volatility has increased recently. ...and implied volatility has again declined. 0.0 0.5 1.0 1.5 2.0 2.5 3.0 3.5 20 40 60 80 100 120 140 2007 2008 2009 2010 2011 2012 2013 WIG stock index (2007, day 1 = 100) Realized volatility (30 days, RHS) Poland: Stock Market Developments (Warsaw Stock Exchange) ��REPUBLIC OF POLAND INTERNATIONAL MONETARY FUND Figure 4. Poland: Banking Sector Developments, 200 5 13 Sources: KNF, NBP, and Fund staff calculations. 1/ Billion zloty. 2/ Percent. 8 10 12 14 16 18 0 1 2 3 4 5 6 2008 2009 2010 2011 2012 2013 Banking Sector Net Profits and Capital Adequacy Ratio Banking sector net profits 1/ Capital adequacy ratio (RHS) 2/ 2 4 6 8 10 12 14 2008 2009 2010 2011 2012 2013 Non - Performing Loans by Sector (Percent of total loans) Total Households Corporates 0 5 10 15 20 25 Credit card lending Other consumer loans Housing loans Other household loans Household Sector Impaired Loans (Zloty billions) 9/2012 12/2012 3/2013 6/2013 9/2013 0 20 40 60 80 100 120 0 20 40 60 80 100 120 2008 2009 2010 2011 2012 Average LTV of Swiss Franc Denominated Loans extended in a given quarter (Percent) In quarter of loan origination Estimate as of April 2013 Quarter of loan origination 0 5 10 15 20 25 Large SME Corporate Sector Impaired Loans (Zloty billions) 9/2012 12/2012 3/2013 6/2013 9/2013 Bank profits have remained stable , capital adequacy has stayed high,... ...and asset quality has started to improve.. . ...alongside a decline in the value of impaired loans in the corporate sector. Nonetheless, the quality of mortgage loans deteriorated further. Vintages of mortgages provided since 2008 are displaying higher NPLs... ...as LTVs of Swiss franc - denominated mortgages have risen, particularly for those issued in 2008. 0.0 0.5 1.0 1.5 2.0 2.5 0.0 0.5 1.0 1.5 2.0 2.5 0 10 20 30 40 50 60 70 Share of Loans in Arrears of More Than 90 Days (Percent of total loans extended in a given year) 2005 2006 2007 2008 2009 2010 2011 Months since beginning of loan origination year ��REPUBLIC OF POLAND INTERNATIONAL MONETARY FUND Figure 5. Poland: Banking Credit Growth and Funding, 2007 13 Sources: Haver Analytics, NBP, KNF, and IMF staff calculations. - 20 0 20 40 60 80 2008 2009 2010 2011 2012 2013 Total Corporates Household mortgages Consumer credit Private Sector Credit Growth (Year - on - year percent change) 0 10 20 30 40 50 60 70 80 2008 2009 2010 2011 2012 2013 Foreign Currency Share of New House Purchase Loans ( Percent of total) 0 10 20 30 40 50 60 70 2007 2008 2009 2010 2011 2012 2013 Private Sector Credit (Percent of GDP) Households (foreign currency) Corporates (foreign currency) Households (zloty) Corporates (zloty) 7 8 9 10 11 12 13 14 15 16 2010 2011 2012 2013 Share in total banking sector liabilities Percent of GDP Bank Liabilities to Parent Banks (Percent) Private sector credit expansion remains slow.. . ...and is supported by domestic funding . The share of new FX mortgage lending has declined considerably... ...contributing to a gradual reduction in household FX loans . The banking sector is less reliant on parent funding... ...with reduced FX hedging needs. 3 4 5 6 7 8 9 2008 2009 2010 2011 2012 2013 Share in total banking sector assets Percent of GDP Banking Sector, On - balance Sheet Open FX Position (Percent) - 20 0 20 40 60 2008 2009 2010 2011 2012 2013 Net foreign assets Net claim on government Deposit growth Others Claims on private sector Contribution to Private Sector Credit Growth (Percentage points) ��REPUBLIC OF POLAND INTERNATIONAL MONETARY FUND Figure 6 . Poland: Reserve Coverage in International Perspective, 2012 1/ (Percent) Sources: World Economic Outlook and IMF staff calculations. 1/ Horizonta l lines represent median in all the charts. 2/ Reserves at the end in percent of short - term debt at remaining maturity and estimated current account deficit in 2012. The current account is set to zero if it is in surplus. 0 20 40 60 80 100 120 140 160 180 0 20 40 60 80 100 120 140 160 180 Egypt Ecuador Venezuela Panama Pakistan Morocco Dominican South Africa India Mexico Brazil China Colombia Turkey Jordan Argentina Ukraine Tunisia El Salvador Chile Guatemala Costa Rica Malaysia Indonesia Jamaica Croatia Poland Thailand Lithuania Bosnia and Bulgaria Russia Philippines Latvia Romania Serbia Peru Uruguay FCL Reserves to Broad Money Rule of thumb: 20% Poland: 36.7% plus 9.9% of FCL 0 100 200 300 400 500 600 700 0 100 200 300 400 500 600 700 Panama Latvia Argentina Ukraine Turkey Lithuania Ecuador Dominican Tunisia El Salvador Poland Costa Rica South Africa Romania Bulgaria Croatia Chile Colombia Jamaica Uruguay Egypt Bosnia and Guatemala India Indonesia Morocco Pakistan Serbia Mexico Jordan Malaysia Brazil Peru Thailand Russia Philippines China FCL Reserves to STD at remaining maturity plus current account 2/ Rule of thumb: 100% Poland: 76.3% plus 24.2% of FCL 0 20 40 60 80 100 120 140 South Africa Panama Venezuela Mexico Jamaica Brazil Indonesia Turkey Lithuania Poland El Salvador Chile Dom. Rep. Colombia Malaysia Uruguay Peru Philippines FCL Reserves to Portfolio Investment Poland: 73.7% plus 23.4% of FCL 0 200 400 600 800 1000 1200 1400 Argentina Ukraine Croatia Ecuador India Thailand Russia Egypt Jordan Latvia Pakistan Costa Rica Tunisia Romania Serbia Guatemala Morocco Bulgaria China FCL Reserves to Portfolio Investment ��REPUBLIC OF POLAND INTERNATIONAL MONETARY FUND Figure 6 . Poland: Reserve Coverage in International Perspective, 2012 1/ ( c oncluded) (Percent) Sources: World Economic Outlook, Balance of Payments Statistics Database, and IMF staff calculations. 1/ Horizonta l lines represent median in all the charts. 2/ The ARA metric was developed by SPR to assess reserve adequacy. For the stock of porfolio liabilities, data on 2011 or 2012 is used, depending on data availability. 0 5 10 15 20 25 0 5 10 15 20 25 Ecuador Egypt Venezuela Panama Jamaica Dominican Pakistan Ukraine Lithuania El Salvador Morocco Tunisia Guatemala Jordan South Africa Costa Rica Latvia Bosnia and Turkey Mexico Poland Chile India Argentina Indonesia Bulgaria Colombia Romania Malaysia Croatia Thailand Serbia Uruguay Philippines Russia Brazil Peru China FCL Reserves to months of imports Rule of thumb: 3 months Poland: 5.8 plus 1.6 of FCL 0% 50% 100% 150% 200% 250% 300% 350% 400% 0% 50% 100% 150% 200% 250% 300% 350% 400% Egypt Panama Ecuador Venezuela Jamaica Dom. Rep. Ukraine Latvia Lithuania El Salvador Morocco Pakistan Tunisia Croatia South Africa Argentina Turkey Jordan Costa Rica Bos. & Herz. Mexico Bulgaria Chile Poland Colombia Indonesia Romania India Guatemala China Russia Brazil Malaysia Thailand Serbia Uruguay Philippines 3/ Peru FCL Reserves to ARA Metric 2/ Rule of thumb: 100 150% Poland: 139% plus 40% of FCL 0 5 10 15 20 25 30 35 40 45 50 0 5 10 15 20 25 30 35 40 45 50 Ecuador Egypt Venezuela Pakistan Panama Dominica Argentina Jamaica Colombia South Africa El Salvador Indonesia Turkey Guatemala Ukraine Mexico India Costa Rica Chile Brazil Morocco Tunisia Lithuania Poland Romania Bosnia Latvia Russia Croatia Jordan Uruguay Philippines Peru Bulgaria Serbia China Malaysia Thailand FCL Reserves to GDP Poland: 22.3% plus 6.0% of FCL ��REPUBLIC OF POLAND INTERNATIONAL MONETARY FUND Figure 7. Poland: Qualification Criteria, 2009 18 0 1 2 3 4 5 6 2009 2010 2011 2012 2013 Inflation with Tolerance Range (Year - on - year percent change) 0 100 200 300 400 500 600 700 800 900 1000 2009 2010 2011 2012 2013 J.P. Morgan Euro EMBI Spread (Basis points) Poland Hungary Romania Bulgaria Low and stable inflation. Relatively comfortable reserve position. Steady sovereign access to capital markets. Sustainable public debt position. Sustainable external position. 40 50 60 70 80 90 100 110 120 2012 2014 2016 2018 Sustainability of External Debt Position (Percent of GDP) Baseline 30 % depreciation Combined 1/ 0 20 40 60 80 100 120 140 160 180 200 0 5 10 15 20 25 30 35 40 GDP Broad money S - T debt (right scale) Net International Reserves, 2013 (Percent) Sources: Bloomberg, Poland authorities, and IMF staff calculations. 1/ Permanent 1/4 standard deviation shocks applied to real interest rate, growth rate, and current account balance. Public: 1% Private: 99% Almost all external debt flows from private creditors. Holders of New Gross External Debt (In percent of total new external debt, 2013Q2) 40 45 50 55 60 2013 2014 2015 2016 2017 2018 Baseline Primary Balance Shock Real GDP Growth Shock Real Interest Rate Shock Real Exchange Rate Shock Sustainability of Public Debt Position (Percent of GDP) 2014: pension reform reduces debt by 9 percentage points of GDP. ��REPUBLIC OF POLAND INTERNATIONAL MONETARY FUND Table 1. Poland: Selected Economic Indicators, 2011 18 20112012201320142015201620172018 Activity and prices GDP (change in percent) 1/4.51.91.32.83.03.13.43.5 Domestic demand3.6-0.1-0.33.23.63.43.43.4 Private consumption growth2.61.20.42.12.92.92.82.9 Public consumption growth-1.70.22.02.22.73.03.53.5 Domestic fixed investment growth8.5-1.7-1.23.66.64.84.74.7 Inventories (contribution to growth)0.7-0.6-0.71.00.10.10.10.1 Net external demand (contribution to growth)0.81.91.30.2-0.6-0.20.10.1 Output gap0.8-0.3-1.5-1.0-0.8-0.50.00.0 CPI inflation (percent) Average4.23.71.22.02.42.52.52.5 End of period4.62.41.42.12.52.52.52.5 Unemployment rate (average, according to LFS)9.610.110.610.510.310.19.79.3 Public finances (percent of GDP) 2/ General government revenues38.438.437.437.738.038.738.639.0 General government expenditures43.442.342.041.341.040.941.041.1 General government balance -5.0-3.9-4.6-3.6-3.0-2.2-2.4-2.2 Public debt56.255.657.549.450.150.048.947.7 National definition 3/53.452.752.8…………… Money and credit Private credit (change in percent)13.92.44.2…………… Broad money (change in percent) 12.54.55.7…………… Policy Rate (percent) 4/4.24.62.5…………… Balance of payments Current account balance (transactions, billion U.S. dollars)-25.0-17.2-13.8-16.4-19.3-21.5-22.7-24.1 Percent of GDP-4.9-3.5-2.7-3.0-3.3-3.5-3.5-3.5 Exports of Goods (billion U.S. dollars)195.2188.4196.9207.5221.0237.8256.0275.5 Export volume growth 7.73.95.07.16.76.77.27.1 Imports of Goods (billion U.S. dollars)209.2195.3199.5211.1226.6242.5260.5280.1 Import volume growth 5.5-0.72.16.98.37.37.27.1 Net oil imports (billion U.S. dollars)22.823.523.624.223.623.223.223.4 Terms of trade (index 1995=100)96.294.794.293.794.495.495.695.6 FDI, net (in percent of GDP)2.20.70.71.11.31.51.51.5 Official reserves (billion U.S. dollars)97.9108.9107.7111.6123.9136.0144.1151.3 In percent of short-term debt plus CA deficit84.991.098.9103.1118.0122.2125.8128.3 Total external debt (billion U.S. dollars)320.6364.2372.6374.3387.5402.1413.6425.6 In percent of GDP62.274.472.868.867.065.563.561.6 Exchange rate Exchange rate regime Zloty per USD, period average 5/3.03.33.1…………… Zloty per Euro, period average 5/4.14.24.2…………… Real effective exchange rate (INS, CPI based) 6/110.4107.6……………… Appreciation (percent change)-1.5-2.6……………… Memorandum item: Nominal GDP (billion zloty)1528.11595.21629.71709.21801.81902.42014.72134.6 Sources: Polish authorities and IMF staff calculations.1/ Real GDP is calculated at constant average prices of previous year. 2/ According to ESA95 (inc. pension reform costs). Including 2011 budget and announced measure as of March 2011. 3/ Excluding debts of the National Road Fund.4/ NBP Reference Rate (avg). For 2013, as of December 2.5/ For 2013, exchange rate as of December 2.6/ Annual average (2000=100). Projections Floating ��REPUBLIC OF POLAND INTERNATIONAL MONETARY FUND Table 2. Poland: Balance of Payments on Transaction Basis, 2011 18 (Millions of US dollars) 20112012201320142015201620172018 Current account balance-25,023-17,169-13,822-16,417-19,269-21,518-22,724-24,065 percent of GDP-4.9-3.5-2.7-3.0-3.3-3.5-3.5-3.5 Trade balance -14,042-6,879-2,644-3,618-5,585-4,730-4,431-4,650 percent of GDP-2.7-1.4-0.5-0.7-1.0-0.8-0.7-0.7 Exports percentage change in unit values15.71.44.55.46.57.67.77.6 percentage volume growth9.23.95.07.16.76.77.27.1 growth in foreign demand 8.00.31.64.84.75.05.65.8 Imports percentage change in unit values15.7-1.62.25.87.37.07.47.5 percentage volume growth7.5-0.72.16.98.37.37.27.1 growth in domestic demand3.6-0.1-0.33.23.63.43.43.4 Terms of trade percentage change-1.6-1.5-0.6-0.60.81.10.20.0 Services balance5,6686,1917,2036,9577,1307,8788,5909,261 Credit37,56237,72639,42141,04443,71947,03750,65154,495 Debit31,89431,53532,21834,08736,58939,15942,06045,234 Net Income-22,880-21,742-23,356-24,683-27,286-29,480-31,993-34,395 Net transfers6,2315,2614,9764,9276,4724,8145,1105,718 o/w EU receipts8,3978,5299,73710,08010,7786,5818,1588,124 o/w payment to EU-5,004-4,893-5,937-6,139-6,596-6,685-6,754-6,831 Capital and financial account balance40,45031,23217,73325,73137,37739,79337,28538,134 Capital account balance10,01710,95313,23015,64716,82316,65516,48916,324 o/w net EU transfers8,8908,80812,75015,05616,18310,56515,20318,039 Financial account balance30,43320,2794,50410,08420,55423,13820,79721,810 Foreign direct investment (net)11,5523,6043,4745,9767,7268,9269,62610,126 by nonresidents18,8873,0921,50714,06116,06117,26118,46119,461 o/w privatization2,3392,5812,5812,5812,5812,5812,5812,581 Portfolio investment (net)16,83519,75016,9977,60715,32714,21211,17011,184 by non-residents16,10920,18217,5518,44416,18915,05612,00012,000 o/w equities3,0523,6121,1865,1822,0002,0002,0002,000 Other investment (net)2,608-5,929-15,968-3,500-2,50000 Assets-3,457-2,015-8,000-2,000-1,500-1,500-1,500-1,500 Liabilities 6,065-3,914-7,968-1,500-1,0001,5001,5002,000 Financial derivatives-5622,854000000 Errors and omissions-9,144-2,862-5,121-5,437-5,781-6,139-6,516-6,906 Overall balance 6,28311,201-1,2093,87612,32712,1368,0457,163 Financing Reserve assets -6,283-11,2011,209-3,876-12,327-12,136-8,045-7,163 Memorandum items: Current plus capital account (percent of GDP)-2.9-1.3-0.1-0.1-0.4-0.8-1.0-1.1 Official reserves 97,866108,914107,705111,581123,908136,044144,089151,252 in months of imports5.66.76.56.36.66.76.66.5 Ratio of reserves to short-term debt 1/108.4106.2113.3121.5144.5151.4156.9161.2 Ratio of reserves to ST debt plus CA deficit 1/84.991.098.9103.1118.0122.2125.8128.3 Total external debt (percent of GDP)62.274.472.868.867.065.563.561.6 Total external debt (percent of exports) 2/137.8161.0157.7150.6146.4141.2134.9129.0 External debt service (percent of exports) 2/ 3/43.249.345.542.334.634.533.933.1 Gross FDI inflows (percent of GDP)3.70.60.32.62.82.82.82.8 Net FDI inflows (percent of GDP)2.20.70.71.11.31.51.51.5 Sources: National Bank of Poland and IMF staff calculations. 1/ Projected reserve level for the year over short-term debt by remaining maturity. 2/ Exports of goods and services. 3/ Excluding repurchase of debt and including deposits. Projections ��REPUBLIC OF POLAND INTERNATIONAL MONETARY FUND Table 3. Poland: Monetary Accounts (eop), 2007 13 2007200820092010201120122013Proj. Central Bank Net foreign assets141177212257317321317 Net domestic assets-38-51-74-117-179-153-146 Net claims on government-26-21-23-12-19-16-16 Claims on banks9-25-74-93-100-93 Other items, net-38-26-31-67-37-37 Base money103126138140138167171 o/w Currency issued86102100103112113114 o/w Bank reserves17253837265457 Deposit Money Banks Net foreign assets-19-113-135-156-169-143-107 Net domestic assets496679762842939953970 Net claims on the central bank393775121130167163 Net claims on government107153171177191177178 Claims on private sector464633677735838858894 Claims on corporates 173224217215253257273 Claims on households 260376421480537538556 Claims on other31334041476365 Other items, net-114-143-161-191-219-248-265 Deposits477566627687771810863 Consolidated Banking System Net foreign assets 1216476101149177209 Net domestic assets441602644683733744765 Claims on government80131148164172161162 Claims on private sector464633677735838858894 Other items, net-104-162-182-217-276-274-291 Broad money (M3)562666720784882921974 Memorandum items: Base money18.223.18.81.6-1.121.02.2 Broad money (M3)13.418.68.18.812.54.55.7 Net domestic assets34.136.67.06.07.41.52.8 Net foreign assets-27.5-46.918.832.646.919.418.1 Net claim on government-13.463.412.811.04.5-6.60.8 Claims on private sector31.536.47.08.513.92.44.2 Deposit growth13.118.910.69.612.25.16.5 Broad money (M3)47.752.253.655.357.757.859.8 Private sector credit 39.449.650.451.954.853.854.8 Broad money Velocity (GDP/M3)2.11.91.91.81.71.71.7 Money multiplier (M3/base money)5.55.35.25.66.45.55.7 Sources: Haver, IFS, National Bank of Poland, and IMF staff calculations. (Billions of zlotys) (Percent of GDP, unless otherwise noted) (Percentage change from end of previous year) ��REPUBLIC OF POLAND INTERNATIONAL MONETARY FUND Table 4. Poland: Financial Soundne ss Indicators, 2007 13 (Percent) 2007200820092010201120122013Q3 Capital adequacy 1/ Regulatory capital to risk-weighted assets12.011.113.313.913.114.815.7 Regulatory Tier I capital to risk-weighted assets11.810.012.012.511.713.114.2 NPLs net of provisions to capital11.48.313.811.511.612.912.6 Bank capital to assets8.07.58.18.27.88.79.0 Asset composition and quality NPLs to gross loans (non-financial sector)5.24.47.98.88.28.88.5 Sectoral distribution of loans to non-financial setor Loans to households59.362.065.368.066.465.765.9 Loans to non-financial corporations40.337.634.331.533.133.733.5 Earnings and profitability Return on average assets (after tax)1.71.50.81.01.31.21.1 Return on average equity (after tax) 1/22.420.711.213.316.114.012.5 Interest margin to gross income59.455.751.953.055.855.054.0 Noninterest expenses to gross income68.758.458.556.054.554.556.8 Liquidity Liquid assets to total assets (liquid assets ratio)17.117.020.320.819.520.922.3 Liquid assets to total short-term liabilities24.225.329.831.228.831.133.5 Loans to deposits98.0112.6109.2114.5119.8117.7115.1 Sensitivity to market risk Net open positions in FX to capital 1/0.60.02.70.3-0.30.2-0.1 Sources: National Bank of Poland and KNF. 1/ Data for domestic banking sector. ��REPUBLIC OF POLAND INTERNATIONAL MONETARY FUND Table 5 . Poland: General Government Statement of Operations, 2011 18 (Percent of GDP ) 20112012201320142015201620172018 Revenue38.438.437.437.738.038.738.639.0 Taxes 20.820.119.119.219.519.919.619.6 Personal income tax4.54.64.54.24.34.44.44.4 Corporate income tax2.12.21.92.02.02.12.12.1 VAT7.97.26.66.87.07.26.96.9 Excises3.93.83.83.93.83.83.83.8 Other taxes2.42.42.32.32.42.52.42.4 Social contributions11.412.312.412.712.913.013.113.2 Other revenue 1/6.26.06.05.85.65.75.96.2 Capital revenue1.81.31.31.31.01.21.41.7 Sales of goods and services2.12.12.12.12.12.12.12.1 Other current revenue2.42.52.52.42.42.42.42.4 Expenditure43.442.342.041.341.040.941.041.1 Expense37.737.738.437.737.537.437.437.2 Compensation of employees9.79.79.79.69.69.59.59.6 Use of goods and services5.75.65.65.75.75.75.75.7 Interest2.72.82.72.32.22.32.22.2 Subsidies0.50.40.40.40.40.40.40.4 Social benefits16.216.416.816.616.516.516.416.3 Other expense 1/2.92.93.23.13.13.13.13.1 Other current expenditure2.42.52.62.42.42.42.42.4 Capital transfers0.70.70.70.70.70.70.70.7 Net acquisition of nonfinancial assets5.74.63.63.73.53.53.63.9 Gross Operating Balance0.70.7-1.00.10.51.31.21.7 Net lending/borrowing (overall balance)-5.0-3.9-4.6-3.6-3.0-2.2-2.4-2.2 Net financial transactions-5.0-3.6-4.6-3.6-3.0-2.2-2.4-2.2 Net acquisition of financial assets-1.3-0.9-1.6-0.30.40.6-0.4-0.4 Currency and deposits-1.30.9-1.7-0.60.10.3-0.7-0.6 Debt securities0.00.00.00.00.00.00.00.0 Loans0.10.00.00.00.10.00.00.0 Equity and investment fund shares-1.3-1.0-0.2-0.1-0.1-0.1-0.1-0.1 Other financial assets1.20.10.30.30.30.30.30.3 Net incurrence of liabilities3.62.53.03.33.42.82.01.8 Currency and deposits0.00.00.00.00.00.00.00.0 Debt securities2.12.61.7-7.12.21.50.80.6 Loans1.40.71.11.11.00.90.80.8 Other liabilities0.10.40.29.20.30.40.40.4 Adjustment and statistical discrepancies -0.1-0.20.00.00.00.00.00.0 Memorandum items: Cyclically-adjusted balance -5.4-3.8-3.4-2.3-2.3-2.0-2.4-2.2 Primary balance-2.3-1.1-1.9-1.3-0.80.0-0.10.0 Cyclically-adjusted primary balance -2.7-1.0-0.60.00.00.2-0.10.0 General government debt56.255.657.549.450.150.048.947.6 General government liabilities63.062.664.756.657.457.356.254.8 General government financial assets-33.0-34.5-36.0-28.9-30.6-31.5-31.4-31.1 Nominal GDP in billions of Zlotys1,5281,5951,6301,7091,8021,9022,0152,135 Sources: Eurostat and IMF staff calculations.1/ Includes grants. Projections �� Table 6. Poland: General Government Financial Balance Sheet, 2011 18 (Millions of Zlotys) REPUBLIC OF POLAND 26 INTERNATIONAL MONETA RY FUND 201320142015201620172018 Trans-actions OEF Closing Opening balance Trans-actions OEF Closing Opening balance Net worth and its changes ................................................ Nonfinancial assets ................................................ Net Financial Worth -75,242-33,092-503,942-59,84312,826-550,959-586,358-493,656-551,494-599,075-632,928-662,980 Financial Assets -20,593-6,774459,025-284-11,543447,198468,806474,579482,288490,187498,979507,318 Currency and deposits -19,323-57243,16614,076-7,74349,49950,56853,03555,91059,03162,51666,235 Debt securities -59-9175,772-1,0325,0975,2075,4615,7576,0786,4376,820 Loans 2,07315,882-429-2,87912,57413,06013,69714,44015,24616,14617,107 Equity and inv. fund shares -19,822287,195-16,5920270,603298,561296,031294,061291,453288,512284,330 Other financial assets 17,712-7,445107,0102,304109,425101,409106,354112,120118,379125,368132,826 Liabilities 54,64926,318962,96759,559-24,369998,1571,055,164968,2351,033,7821,089,2621,131,9071,170,298 Currency and deposits 000000000000 Debt securities 32,31521,233719,27341,865-18,482742,656824,659726,487778,929820,182846,941868,379 Loans 21,2347,850143,19711,915-5,887149,225111,989117,451123,818130,730138,448146,685 Other liabilities 1,100-2,765100,4975,7790106,276118,516124,297131,035138,350146,517155,234 Memorandum items:Net financial worth (percent of GDP)-33.0-34.5-36.0-28.9-30.6-31.5-31.4-31.1Financial assets (percent of GDP)30.028.028.827.826.825.824.823.8Liabilities (percent of GDP)63.062.664.756.657.457.356.254.8GDP nominal prices (billion PLN)1528.11595.21629.71709.21801.81902.42014.72134.6 Sources: National Authorities and IMF Staff calculations. Projections 2011 2012 ��REPUBLIC OF POLAND INTERNATIONAL MONETARY FUND Table 7. Poland: External Financing Requirements and Sources, 2009 15 (Millions of US dollars ) 2009201020112012201320142015 Gross financing requirements96,516122,644112,263120,461110,934118,839109,639 Current account deficit17,15524,03025,02317,16913,82216,41719,269 Medium and long-term debt amortization12,67526,24318,48432,73431,11934,08626,042 Public sector 6,8214,92313,94713,45615,98513,193 Banks3,2026,6374,4478,6373,3878,4634,774 Non-bank Corporates8,77612,7859,11410,15014,2769,6388,075 Short-term debt amortization66,68672,37168,75670,55865,99368,33564,329 Public sector1,1471,1692,4822,7304,0955,119 Banks (inc. s.t. deposits)29,91223,49521,36819,25014,43814,43815,882 Non-bank Corporates35,62747,70746,88048,82648,82649,80243,328 o/w trade credit28,62731,15331,45732,76332,76333,41829,074 Sources of financing111,258137,776118,546131,662109,725122,715121,967 Foreign direct investment (net)8,4606,86111,5523,6043,4745,9767,726 o/w inward (net)13,02214,34518,8873,0921,50714,06116,061 Equities (net)-2836,8723,7323,0464,2991,091 by nonresidents1,5797,8753,0523,6121,1865,1822,000 New borrowing and debt rollover113,647153,67398,551107,059114,34391,249108,437 Medium and long-term borrowing41,27684,91727,99341,06546,00826,92042,109 Public sector19,64729,53612,50819,57124,0628,20315,308 Banks3,58049,3253,6176,2693,3878,8866,785 Non-bank Corporates18,0496,05611,86815,22518,5599,83120,016 Short-term borrowing72,37168,75670,55865,99368,33564,32966,329 Public sector 1,1692,4822,7304,0955,1195,119 Banks23,49521,36819,25014,43814,43815,88215,882 Foreign subsidiaries to parent banks12,67511,52810,3857,7897,7898,5688,568 Other10,8209,8408,8656,6496,6497,3147,314 Non-bank Corporates47,70746,88048,82648,82649,80243,32845,328 EU transfers7,1916,8738,8908,80812,75015,05616,183 Other-17,757-36,503-4,1799,145-21,4296,134-11,471 of which: Errors and omissions-10,045-10,462-9,144-2,862-5,121-5,437-5,781 Buffers Use of official reserves-14,742-15,132-6,283-11,2011,209-3,876-12,327 Financing gap Sources: National authorities and IMF staff calculations. Projections ��REPUBLIC OF POLAND INTERNATIONAL MONETARY FUND Table 8 . Poland: Capacity to R epay the Fund , 2014 19 201420152016201720182019Stocks from prospective drawings 1/Fund credit (millions SDR)22,00022,00022,00013,7502,7500in percent of quota1,3031,3031,303814163in percent of GDP666310in percent of exports of goods and services141312710in percent of gross reserves 2/3027251530Flows from prospective drawings 3/GRA Charges191242242215101Level Based Surcharge267339339400126Service Charges00000Principal0008,25011,0002,750Debt Service due on GRA credit (millions SDR)5685815818,86511,2272,756in percent of quota343434525665163in percent of GDP000231in percent of exports of goods and services000451in percent of gross reserves 2/1119Memorandum item:Total external debt, assuming full drawing (percent of GDP)757371676260Sources: IMF Finance Department, Polish authorities, and IMF staff calculations.2/ Excludes IMF purchases. Projections 3/ Based on the rate of charge as of December 5th, 2013. Includes surcharges under the system currently in force and service charges. 1/ End of Period. Assumes full drawing under the FCL at the start of 2014. The Polish authorities have expressed their intention to treat the arrangement as precautionary. At an SDR/USD rate of 0.648041 as of December 12, ��REPUBLIC OF POLAND INTERNATIONAL MONETARY FUND Annex I. External Debt Sustainability Analysis Poland: External Debt Sustainability: Bound Tests , 2008 18 1/ 2/ (External debt, percent of GDP) i - rate shock 63 Baseline 62 20 30 40 50 60 70 80 90 100 2008 2010 2012 2014 2016 2018 Interest rate shock (in percent) Sources: International Monetary Fund, Country desk data, and staff estimates. 1/ Shaded areas represent actual data. Individual shocks are permanent one - half standard deviation shocks. Figures in the boxes represent average projections for the respective variables in the baseline and scenario being presented. Ten - year historical average for the variable is also shown. 2/ For historical scenarios, the historical averages are calculated over the ten - year period, and the information is used to project debt dynamics five years ahead. 3/ Permanent 1/4 standard deviation shocks applied to real interest rate, growth rate, and current account balance. 4/ One - time real depreciation of 30 percent occurs in 2014. Historical 53 Baseline 62 0 5 10 15 20 25 30 20 30 40 50 60 70 80 90 100 2008 2010 2012 2014 2016 2018 Baseline and historical scenarios CA shock 65 Baseline 62 20 30 40 50 60 70 80 90 100 2008 2010 2012 2014 2016 2018 65 Baseline 62 20 30 40 50 60 70 80 90 100 2008 2010 2012 2014 2016 2018 Combined shock 3/ Combined shock 86 Baseline 62 20 30 40 50 60 70 80 90 100 2008 2010 2012 2014 2016 2018 Real depreciation shock 4/ 30% depreciation Gross financing need under baseline (right scale) Non - interest current account shock (in percent of GDP) Growth shock 64 Baseline 62 20 30 40 50 60 70 80 90 100 2008 2010 2012 2014 2016 2018 Baseline : Scenario : Historical : 2.9 3.2 2.4 Baseline : Scenario : Historical: 3.2 2.3 4.3 Baseline: Scenario : Historical: - 1.6 - 2.3 - 3.3 Growth shock (in percent per year) �� Poland: External Debt Sustainability Framework, 200 8 18 (Percent of GDP, unless otherwise indicated) REPUBLIC OF POLAND 30 INTERNATIONAL MONETA RY FUND Projections 20082009201020112012201320142015201620172018Debt-stabilizingnon-interest current account 6/Baseline: External debt46.264.967.162.274.472.868.867.065.563.461.6-2.82Change in external debt-8.618.72.2-4.912.2-1.6-3.9-1.8-1.5-2.0-1.93Identified external debt-creating flows (4+8+9)-5.411.1-3.1-3.84.50.8-1.0-0.3-0.2-0.4-0.44Current account deficit, excluding interest payments5.43.44.03.82.11.41.72.01.81.31.05Deficit in balance of goods and services-85.7-80.0-86.3-91.9-92.5-91.4-90.8-91.3-92.3-93.5-94.86Exports40.439.642.245.146.246.145.745.846.447.047.77Imports -45.3-40.3-44.1-46.8-46.3-45.3-45.1-45.5-45.9-46.4-47.18Net non-debt creating capital inflows (negative)-2.1-2.3-3.1-2.8-1.5-0.9-2.1-1.7-1.8-1.8-1.89Automatic debt dynamics 1/-8.710.1-4.0-4.83.90.3-0.6-0.6-0.30.00.4Contribution from nominal interest rate1.20.61.11.11.41.31.31.41.72.12.5Contribution from real GDP growth -2.3-0.9-2.3-2.8-1.3-1.0-1.9-1.9-2.0-2.1-2.1Contribution from price and exchange rate changes 2/ -7.610.4-2.8-3.13.7..................Residual, incl. change in gross foreign assets (2-3) 3/-3.37.65.3-1.17.7-2.4-3.0-1.5-1.3-1.6-1.5External debt-to-exports ratio (in percent)114.4163.8158.9137.8161.0157.7150.6146.4141.2134.9129.0Gross external financing need (in billions of US dollars) 4/125.895.7120.3120.0121.7114.8114.4103.0109.4112.6115.9in percent of GDP23.822.225.623.324.810-Year10-Year22.421.017.817.817.316.8Scenario with key variables at their historical averages 5/72.867.563.960.556.853.3-6.5HistoricalStandard Key Macroeconomic Assumptions Underlying BaselineAverageDeviationReal GDP growth (in percent)5.11.63.94.51.94.31.71.32.83.03.13.43.5GDP deflator in US dollars (change in percent)18.4-19.84.85.0-6.85.611.63.23.33.23.02.62.4Nominal external interest rate (in percent)2.81.01.91.72.22.40.71.81.92.12.73.54.2Growth of exports (US dollar terms, in percent)22.8-20.116.017.3-2.915.915.84.55.26.57.67.77.6Growth of imports (US dollar terms, in percent)27.1-27.419.116.4-5.915.218.42.25.87.37.07.47.5Current account balance, excluding interest payments -5.4-3.4-4.0-3.8-2.1-3.31.4-1.4-1.7-2.0-1.8-1.3-1.0Net non-debt creating capital inflows 2.12.33.12.81.52.81.20.92.11.71.81.81.81/ Derived as [r - g - r(1+g) + ea(1+r)]/(1+g+r+gr) times previous period debt stock, with r = nominal effective interest rate on external debt; r = change in domestic GDP deflator in US dollar terms, g = real GDP growth rate, e = nominal appreciation (increase in dollar value of domestic currency), and a = share of domestic-currency denominated debt in total external debt. 2/ The contribution from price and exchange rate changes is defined as [-r(1+g) + ea(1+r)]/(1+g+r+gr) times previous period debt stock. r increases with an appreciating domestic currency (e � 0) and rising inflation (based on GDP deflator). 3/ For projection, line includes the impact of price and exchange rate changes.4/ Defined as current account deficit, plus amortization on medium- and long-term debt, plus short-term debt at end of previous period. 5/ The key variables include real GDP growth; nominal interest rate; dollar deflator growth; and both non-interest current account and non-debt inflows in percent of GDP.6/ Long-run, constant balance that stabilizes the debt ratio assuming that key variables (real GDP growth, nominal interest rate, dollar deflator growth, and non-debt inflows in percent of GDP) remain at their levels of the last projection year. Actual ��REPUBLIC OF POLAND INTERNATIONAL MONETARY FUND Annex Public Sector Debt Sustainability Analysis Public debt is moderately high, at 58 percent of GDP in 2013, but sustainable. Forthcoming modifications to the pension system’s second pillar will lead to a sizable one-off drop in the public debt--GDP ratio to 49 percent of GDP in 2014. Gross public financing needs are also projected to decline from 9.5 percent of GDP in 2013 to 8 percent of GDP in 2014, helped by the pension system changesThe profile of public debt appears robust to interest, rollover, and foreign currency risks. The main risk to the debt outlook stems from a negative shock to GDP growth. In addition, the relatively large share of foreign investors in the domestic debt marketwhich is set to increase as a result of the pension changestails a channel of transmission from global shocks, albeit the composition of the investor base is a mitigating factor. Baseline and Realism of Projections Debt levelsPoland’s favorable public bt dynamics are underpinned by a decline in the primary deficit, a favorable differential between projected GDP growth and the real interest rate, and the effects of forthcoming changes to the pension system. Gross financing needs are estimated at 9.5 percent of GDP in 2013 (down from an average of 15.5 percent of GDP in 2000‒12), and are projected to drop further to 8 percent of GDP in 2014 and around 6 percent of GDP in 2018. Changes to the pension system. Public debt projections under the baseline are strongly influenced by forthcoming changes to the pension system (see Box 1 in the main text). From the fiscal perspective, these changes will generate a one-off drop in (explicit) public debt in 2014 of 9 percent of GDP (with a matching increase in implicit public pension liabilities), plus a reduction in public financing needs over the medium term (rising to about 2¾ percent of GDP by 2018). The latter reflects the combined effect of lower public debt service, a partial redirection of pension contributions from the second pillar to the social security administration, and a gradual transfer of assets to the social security administration ten years before retirement. By contrast, the associated increase in public pension payments will gather pace in the long run, well beyond the projection period (staff is in the process of preparing a comprehensive analysis of the long-run fiscal implications of the changes to the pension system, which will be reported at the time of the 2014 Article IV consultation). GDP Growth. The projections assume a gradual acceleration of GDP growth, from 1.3 percent in 2013 to 2.8 percent in 2014 and further to 3.5 percent in 2018. The output gap is expected to close gradually over the medium term. In recent years, staff projections of growth have displayed small forecast errors, with some pessimistic bias relative to other countries. Fiscal Adjustment. Under the baseline, the primary deficit is expected to decline from 1.9 percent of GDP in 2013 to about balance in 2015‒18, reflecting modest fiscal measures already in the pipeline, the changes to the pension system, and the gradual recovery in tax revenue (to bring it closer to recent historical levels). Pension changes account for the bulk of ��REPUBLIC OF POLAND INTERNATIONAL MONETARY FUND the improvement in fiscal aggregates and the associated drop in debt under the baseline. In the recent past, staff forecast errors of the primary deficit in Poland have not displayed an apparent bias and have been more conservative than those of other countries. Warning benchmarks highlight the size of the projected three-year improvement in the cyclically adjusted primary balance (4.4 percent), which takes place in 2013 and reflects the impressive fiscal consolidation achieved since 201Sovereign yields. The effective interest rate on public debt dropped from 6.6 percent in 2005 to 5.9 percent in 2009 and further to about 5 percent in 2013. It is projected to remain stable at around 4.8 percent over the projection period. In recent years, Poland has maintained access to capital markets at favorable terms, even during periods of global financial distress. In 2013, bond yields dropped to historic lows and have remained lownotwithstanding an increase during the recent episode of turmoil in emerging markets. Spreads over 10‒year German bonds stand close to their yearly average 236 bps (after reaching a minimum of 176 bps in May and a maximum of 285 bps in September), while EMBI and CDS spreads have remained at around 130 bps and bps, respectively. While there is uncertainty about the impact of eventual Fed tapering on market conditions, pass-through from interest increases to the budget would be very slow, as about 80 percent of debt carries a fixed interest rate and the average duration stands at 3.6 years. A 100 bps parallel shift in the yield curve will lead to an increase in the interest bill of about 0.1 percent of GDP in the first year. Maturity and rollover risks. The share of short-term debt in total government debt is negligible (there have been no t-bills outstanding since August 2013) and, after covering the full 2013 financing needs by October, the authorities have started to pre-finance 2014 needs. Going forward, however, rollover risk may increase somewhat as a result of the pension changes: the share of foreign investors in the domestic market is set to increase from about 34 percent in 2013 to percent in 2014 and the overall share of external debt in total public debt will rise from 52 percent in 2013 to almost 60 percent in 2014. In addition, the share of foreign currency debt in total public debt will also increase from 30 percent in 2013 to 35 percent in 2014. The baseline assumes gradual convergence toward the current structure of public debt in terms of the share of foreign currency debt in total public debt (30 percent) and external debt in total public debt (about 50 percent). DSA risk assessment. The heat map highlights risks associated with the share of public debt held by non-residents, plus the relatively large external financing requirements (25 percent of GDP in 2012). The latter, however, is heavily influenced by the external gross financing needs of the private sector, which include a substantial share of cross-border, intra-company, financing. Fan charts. Symmetric fan charts, which treat side and downside risks equally likely, show that public debt is more likely to enter a downward trajectory during the projection period. The lower bands indicate that the debt--GDP ratio could drop to around 40 percent by 2018 with a percent probability. On the other hand, the upper bands indicate that debt--GDP ratios could surpass percent by 2018 with a 5 percent probability. A more stringent exercise, however, combining restrictions to the upside shocks to interest rates and GDP growth (200 bps ��REPUBLIC OF POLAND INTERNATIONAL MONETARY FUND and 1 percent, respectively)increases the probability of debt--GDP surpassing percent in 2018 to 25 percent. This result is still commensurate with a sustainable debt path, but it illustrates the degree of uncertainty around the baseline.Shocks and Stress Tests Growth Shock. The stress scenario assumes a drop in GDP growth by 1.7 percentage points in two consecutive years (2014‒15) relative to the baseline, combined with a 0.4 percent drop in inflation and deterioration in the primary balance by 0.8 percent in 2014 and further by 1.6 percent in 2015Under these assumptions, public debt increases to about 54 percent of GDP in 2015 before trending downward slightly to 52 percent of GDP by 2018. Gross financing needs increase to about 11 percent of GDP in 2015, but then converge quickly toward the baseline in the outer years. Primary balance shock. An assumed deterioration in the primary balance by 0.9 percentage points in 2014‒15 delays by two years the downward trend of the debt--GDP ratio and pushes up public debt to revenues to about 136 percent in 2015 (from 133 in 2014) but still well below current levels. Similarly, gross financing needs peak to about 10 percent of GDP in 2015 but converge to the baseline by 2018. Interest rate shockpermanent 438 bps increase in the nominal interest rate starting in 2014 (equivalent to the difference between the maximum real interest rate during 2002‒12 and the average real interest rate over the projection), would lead to an increase in the effective interest rate on debt by 71 bps in 2015 and further gradual increases to 252 bps by 2018. Under this scenario, public debt dynamics deteriorate gradually relative to the baselinePublic debt increases to about 52 percent of GDP by 2018, while gross financing needs reach about 8 percent of GDP at the end of the projection period. Combined shockUnder the combined shock, the public-debt--GDP ratio jumps sharply to about 60 percent in 2016 and remains broadly stable afterward. In turn, gross financing needs increase to about 12 percent of GDP in 2015, before trending downward to about 8.5 percent in ��REPUBLIC OF POLAND INTERNATIONAL MONETARY FUND Poland: Public Sector D ebt S ustainability A nalysis (DSA) Risk Assessment Poland Source: IMF staff. 1/ The cell is highlighted in green if debt burden benchmark of 70% is not exceeded under the specific shock or baseline, yellow if exceeded under specific shock but not baseline, red if benchmark is exceeded under baseline, white if stress test is not relevant. Real Interest Rate Shock External Financing Requirements Real GDP Growth Shock Heat Map Upper early warning Evolution of Predictive Densities of Gross Nominal Public Debt (in percent of GDP) Debt profile Lower early warning (Indicators vis-à-vis risk assessment benchmarks, in 2012) Debt Profile Vulnerabilities Gross financing needs Debt level Real GDP Growth Shock Primary Balance Shock 3/ The cell is highlighted in green if country value is less than the lower risk-assessment benchmark, red if country value exceeds the upper risk-assessment benchmark, yellow if country value is between the lower and upper risk-assessment benchmarks. If data are unavailable or indicator is not relevant, cell is white. Lower and upper risk-assessment benchmarks are: Change in the Share of Short-Term Debt Foreign Currency Debt Public Debt Held by Non-Residents Primary Balance Shock Real Interest Rate Shock Exchange Rate Shock Contingent Liability Shock Exchange Rate Shock Contingent Liability shock 5/ External financing requirement is defined as the sum of current account deficit, amortization of medium and long-term total external debt, and short-term total external debt at the end of previous period. 4/ Long-term bond spread over German bonds, an average over the last 3 months, 30-Jul-13 through 28-Oct-13. 2/ The cell is highlighted in green if gross financing needs benchmark of 15% is not exceeded under the specific shock or baseline, yellow if exceeded under specific shock but not baseline, red if benchmark is exceeded under baseline, white if stress test is not relevant. 200 and 600 basis points for bond spreads; 5 and 15 percent of GDP for external financing requirement; 0.5 and 1 percent for change in the share of short-term debt; 15 and 45 percent for the public debt held by non-residents; and 20 and 60 percent for the share of foreign-currency denominated debt. Market Perception 20 60 32% 1 2 200 600 252 bp 1 2 5 15 25% 1 2 0.5 1 - 0.4% 1 2 Bond spread External Financing Requirement Annual Change in Short - Term Public Debt Public Debt in Foreign Currency (in basis points) 4/ (in percent of GDP) 5/ (in percent of total) (in percent of total) 0 10 20 30 40 50 60 70 2011 2012 2013 2014 2015 2016 2017 2018 10th - 25th 25th - 75th 75th - 90th Percentiles: Baseline Symmetric Distribution 0 10 20 30 40 50 60 70 80 2011 2012 2013 2014 2015 2016 2017 2018 Restricted (Asymmetric) Distribution 1 is the max positive growth rate shock (percent) 2 is the max negative interest rate shock (percent) no restriction on the primary balance shock no restriction on the exchange rate shock Restrictions on upside shocks: 15 45 53% 1 2 Public Debt Held by Non - Residents (in percent of total) ��REPUBLIC OF POLAND Poland: Public DSA Realism of Baseline Assumptions REPUBLIC OF POLAND INTERNATIONAL MONETA RY FUND 35 ��REPUBLIC OF POLAND INTERNATIONAL MONETARY FUND Poland: Public DSA Baseline Scenario (Percent of GDP, unless otherwise indicated ) As of October 28, 2013 20112012201320142015201620172018Sovereign Spreads Nominal gross public debt47.556.255.657.549.450.150.048.947.6EMBIG (bp) 3/ Public gross financing needs16.711.812.19.88.49.27.77.06.85Y CDS (bp) Real GDP growth (in percent)4.24.51.91.32.83.03.13.43.5Ratings Foreign Local Inflation (GDP deflator, in percent)2.63.22.40.82.02.42.42.42.3Moody'sA2A2 Nominal GDP growth (in percent)6.97.94.42.24.95.45.65.95.9S&PsA-A- Effective interest rate (in percent) 6.35.35.35.04.24.84.84.84.8FitchA-A- 20112012201320142015201620172018cumulative Change in gross public sector debt1.91.4-0.61.9-8.10.7-0.1-1.1-1.4-8.0 Identified debt-creating flows0.91.9-1.53.1-8.40.1-0.9-0.9-1.0-8.0 Primary deficit2.42.31.11.91.30.80.00.10.04.0 Primary (noninterest) revenue and grants 38.838.438.437.437.738.038.738.639.0229.4 Primary (noninterest) expenditure41.240.839.539.339.038.838.738.738.9233.4 Automatic debt dynamics 5/ -0.71.0-1.21.5-0.4-0.3-0.4-0.5-0.5-0.6 Interest rate/growth differential -0.3-1.30.51.5-0.4-0.3-0.4-0.5-0.5-0.6 Of which: real interest rate 1.51.01.52.31.21.11.11.11.17.8 Of which: real GDP growth -1.8-2.3-1.0-0.7-1.5-1.4-1.5-1.6-1.6-8.4 Exchange rate depreciation -0.42.3-1.7………………… Other identified debt-creating flows-0.7-1.4-1.4-0.4-9.3-0.4-0.5-0.5-0.4-11.4 Privatization (+ reduces financing needs) (negative) -0.5-1.3-1.0-0.2-0.1-0.1-0.1-0.1-0.1-0.7 Contingent liabilities 0.00.00.00.00.00.00.00.00.00.0 Liabilities not included in debt -0.2-0.1-0.4-0.2-9.2-0.3-0.4-0.4-0.4-10.7 Residual, including asset changes 1.0-0.50.9-1.20.30.60.7-0.2-0.3-0.1 Source: IMF staff.1/ Public sector is defined as general government.2/ Based on available data.3/ Long-term bond spread over German bonds.4/ Defined as interest payments divided by debt stock (excluding guarantees) at the end of previous year.5/ Derived as [(r - π(1+g) - g + ae(1+r)]/(1+g+π+gπ)) times previous period debt ratio, with r = interest rate; π = growth rate of GDP deflator; g = real GDP growth rate;a = share of foreign-currency denominated debt; and e = nominal exchange rate depreciation (measured by increase in local currency value of U.S. dollar).6/ The real interest rate contribution is derived from the numerator in footnote 5 as r - π (1+g) and the real growth contribution as -g.7/ The exchange rate contribution is derived from the numerator in footnote 5 as ae(1+r). 8/ From 2014 onwards, reflects the transfer of pension fund assets and liabilities to the social security administration.9/ Includes asset changes and interest revenues (if any). For projections, includes exchange rate changes during the projection period.10/ Assumes that key variables (real GDP growth, real interest rate, and other identified debt-creating flows) remain at the level of the last projection year. -1.0 balance primary Debt, Economic and Market Indicators 2002-2010 Actual Projections Contribution to Changes in Public Debt Projections 2002-2010 Actual debt-stabilizing - 15 - 10 - 5 0 5 10 2002 2003 2004 2005 2006 2007 2008 2009 2010 2011 2012 2013 2014 2015 2016 2017 2018 Debt - Creating Flows Primary deficit Real GDP growth Real interest rate Exchange rate depreciation Other debt - creating flows Residual Change in gross public sector debt projection (in percent of GDP) - 25 - 20 - 15 - 10 - 5 0 5 10 15 cumulative ��REPUBLIC OF POLAND INTERNATIONAL MONETARY FUND Poland: Public DSA Co mposition of Public Debt and Alternative Scenarios Baseline Scenario201320142015201620172018Historical Scenario201320142015201620172018Real GDP growth1.32.83.03.13.43.5Real GDP growth1.34.34.34.34.34.3Inflation0.82.02.42.42.42.3Inflation0.82.02.42.42.42.3 Primary Balance -1.9-1.3-0.80.0-0.10.0 Primary Balance -1.9-2.2-2.2-2.2-2.2-2.2Effective interest rate5.04.24.84.84.84.8Effective interest rate5.04.24.95.05.05.1Constant Primary Balance ScenarioReal GDP growth1.32.83.03.13.43.5Inflation0.82.02.42.42.42.3 Primary Balance -1.9-1.9-1.9-1.9-1.9-1.9Effective interest rate5.04.24.84.84.74.7Source: IMF staff. Underlying Assumptions (in percent) Alternative Scenarios Composition of Public Debt Baseline Historical Constant Primary Balance 0 10 20 30 40 50 60 70 2011 2012 2013 2014 2015 2016 2017 2018 Gross Nominal Public Debt (in percent of GDP) projection 0 2 4 6 8 10 12 14 2011 2012 2013 2014 2015 2016 2017 2018 Public Gross Financing Needs (in percent of GDP) projection 0 10 20 30 40 50 60 70 2002 2004 2006 2008 2010 2012 2014 2016 2018 By Maturity Medium and long - term Short - term (in percent of GDP) projection 0 10 20 30 40 50 60 70 2002 2004 2006 2008 2010 2012 2014 2016 2018 By Currency Local currency - denominated Foreign currency - denominated (in percent of GDP) projection ��REPUBLIC OF POLAND INTERNATIONAL MONETARY FUND Poland: Public DSA Stress Tests Primary Balance Shock201320142015201620172018Real GDP Growth Shock201320142015201620172018 Real GDP growth 1.32.83.03.13.43.5 Real GDP growth 1.31.11.33.13.43.5 Inflation0.82.02.42.42.42.3Inflation0.81.62.02.42.42.3 Primary balance -1.9-2.1-1.70.0-0.10.0 Primary balance -1.9-2.1-2.40.0-0.10.0 Effective interest rate5.04.24.84.84.84.8Effective interest rate5.04.24.84.84.84.8 Real Interest Rate ShockReal Exchange Rate Shock Real GDP growth 1.32.83.03.13.43.5 Real GDP growth 1.32.83.03.13.43.5 Inflation0.82.02.42.42.42.3Inflation0.88.72.42.42.42.3 Primary balance -1.9-1.3-0.80.0-0.10.0 Primary balance -1.9-1.3-0.80.0-0.10.0 Effective interest rate5.04.25.56.36.97.3Effective interest rate5.04.64.74.74.74.7 Combined Shock Real GDP growth 1.31.11.33.13.43.5 Inflation0.81.62.02.42.42.3 Primary balance -1.9-2.1-2.40.0-0.10.0 Effective interest rate5.04.65.46.26.87.2 Source: IMF staff. (in percent) Real Exchange Rate Shock Combined Macro-Fiscal Shock Additional Stress Tests Baseline Underlying Assumptions Macro-Fiscal Stress Tests Baseline Primary Balance Shock Real GDP Growth Shock Real Interest Rate Shock 0 10 20 30 40 50 60 70 2013 2014 2015 2016 2017 2018 Gross Nominal Public Debt (in percent of GDP) 0 20 40 60 80 100 120 140 160 180 2013 2014 2015 2016 2017 2018 Gross Nominal Public Debt (in percent of Revenue) 0 2 4 6 8 10 12 2013 2014 2015 2016 2017 2018 Public Gross Financing Needs (in percent of GDP) 0 10 20 30 40 50 60 70 2013 2014 2015 2016 2017 2018 Gross Nominal Public Debt (in percent of GDP) 0 20 40 60 80 100 120 140 160 180 2013 2014 2015 2016 2017 2018 Gross Nominal Public Debt (in percent of Revenue) 0 2 4 6 8 10 12 14 2013 2014 2015 2016 2017 2018 Public Gross Financing Needs (in percent of GDP) Press Release No . 14/05 FOR IMMEDIATE RELEASE January 8, 2014 IMF Executive Board Completes Review of Poland’s Performance under the Flexible Credit Line T he Executive Board of the International Monetary Fund (IMF) today completed its review of Poland’s qualification for the arrangement under the Flexible Credit Line (FCL) and reaffirmed Poland’s continued qualification to access FCL resources. The Polish authorities have indicated that they intend to continue treating th e arrangement as precautionary. The IMF has supported the authorities’ policies with four successive FCL arrangements. The current two - year FCL arrangement for Poland was approved by the IMF’s Executive Board on January 18, 2013 (see Press Release No. 13/17 ) in an amount equivalent to SDR 22 billion (about US $ 33. 7 billion ) . Poland’s first FCL arrangement was approved on May 6 , 2009 for an amount of SDR 13. 69 billion (ab out US $ 2 1 billion ) (see Press Release No. 09/1 53 ) . Successor arrangement s were approved in July 2010 ( see Press Release No. 10/276 ) and in January 2011 (see Press Release No. 11/15 ) . Following the Executive Board discussion on Poland, Mr. David Lipton, First Deputy Managing Director and Acting Chai r, made the following statement: “Poland continues to have in place sound macroeconomic management and strong fundamentals, including a well - established inflation targeting regime, a robust fiscal framework that balances short - term economic considerations with the need to preserve long - term fiscal sustainability, and an effective financial supervisory framework that has safeguarded financial stability. “The FCL arrangement with the IMF has reinforced Poland’s capacity to deal with adverse external shocks, providing the authorities with needed flexibility to implement their macroeconomic framework, while rebuilding policy buffers and continuing structural reforms. Today, the Executive Board reaffirmed that Poland continues to meet the qualification criteria for access to FCL resources. International Monetary Fund Washington, D.C. 20431 USA 2 “The Polish economy is beginning to recover from a sharp slowdown. However, external risks remain elevated, including the possibility of increased financial stress in the euro area, a protracted period of low growth in broader Europe, and a sudden reversal of capital flows as advanced countries exit from unconventional monetary policies. “ Poland’s FCL arrangement, which the authorities continue to treat as precautionary, provides added insurance against these risks. The authorities intend to exit from the FCL arrangement as soon as external conditions allow .” Statement by Mr. Dominik Radziwill, Alternate Executive Director for the Republic of Poland, and Ms. Osinska, Advisor to the Executive Director January 8, 2014 On behalf of our Polish authorities, we thank staff for fruitful discussions held in Warsaw and for a candid report recommending the completion of the review under the Flexible Credit Line (FCL) Arrangement. The current FCL and its predecessors have served the Polish economy very well, effectively complementing the country’s strong macroeconomic fundamentals and sound policies. During the last few years of heightened risks in Poland’s external environment, the FCL has provided continued insurance against adverse exogenous shocks a nd helped support investors’ confidence. Our authorities reaffirm their intention to treat the instrument as precautionary. Furthermore, the ongoing accumulation of policy buffers supported by the FCL will help taking steps towards an exit from the arrange ment as soon as external conditions allow. Economic Outlook Recent economic data surprised on the upside. Following four consecutive quarters of subdued growth, real GDP growth rebounded to 0.5 and 0.6 percent quarter - on - quarter (seasonally adjusted; q - o - q, sa) in the second and third quarter of 2013, respectively. In the second half of the year, private consumption and fixed investment turned out to be higher than expected. Real year - on - year (y - o - y) GDP growth reached 1.9 percent in Q3 2013. For 2013 as a whole, real GDP growth should be close to 1.5 percent — as officially forecast by the Ministry of Finance — primarily driven by net exports. Looking ahead, growth is expected to accelerate further this year, to close to 3 percent, on the b ack of the expected improvement in external demand as well as more optimistic business and consumer sentiment. Given strong trade, financial and confidence linkages with Europe and global financial markets, we see risks to the outlook dominated by external factors. While the Polish labor market remains relatively weak, a small but noticeable improvement has also been recorded in the second half of 2013. The seasonally adjusted jobless rate decreased to 10.2 percent and recent high - frequency data point to a stabilization of la bor demand. Monetary Policy Despite the recent increase in the CPI (from the record low of 0.2 percent in June to 0.8 and 0.6 percent y - o - y in October and November respectively), inflation remains much below the official target. The negative output gap a nd continued lack of wage pressure have translated into overall low inflation pressure. Inflation expectations are also very subdued. The PPI has remained in negative territory since end - 2012. After completion of the monetary easing cycle in July 2013, wh ich resulted in cuts in policy rates of 225 basis points, the Monetary Policy Council (MPC) has kept the reference rate at an all - time low of 2.5 percent. Furthermore, in November the MPC provided forward guidance about its intention to keep policy rates o n hold until at least mid - 2014. 2 External Sector The current account (CA) deficit remains sustainable, and stabilized at 2 percent of 12 - month GDP in September. The capital account surplus (mainly due to EU structural funds inflows) and net FDI inflows cov ered almost 150 percent of the CA deficit. September also brought an end to the three - month period of moderate outflow of portfolio investments from the sovereign debt market. Notably, this emerging market sell - off affected Poland less than many other peer economies. The level of official reserves remains broadly adequate, more than covering short - term external debt. Fiscal Policy The authorities aimed at striking a balance between necessary consolidation measures and avoiding fiscal policy to become a dra g on economic growth. In response to the cyclical slowdown in 2013, automatic stabilizers were thus allowed to operate. However, lower economic growth resulting in a decline in government revenues hindered the realization of the fiscal adjustment path fore seen in the Convergence Programme update 2013. While Poland presented a set of measures aimed at deficit reduction, the actions taken were assessed as insufficient and, in response, the Ecofin Council issued a new recommendation, extending the deadline for correction of Poland’s deficit by one year, to 2015. To this end, Poland should reach a headline deficit target of 3.9 percent of GDP in 2014 and 2.8 percent of GDP in 2015 (excluding the impact of the changes in the pension system). Last year, the authorities concluded a comprehensive review of the pension system and decided to introduce changes to its second pillar in order to eliminate existing inefficiencies. In result, part of the pension fund assets (sovereign treasuries) will be transferred fr om the second (privately managed) to the first (public) pillar. This one - off operation will lead to a significant reduction of the public debt. Changes to the pension system were subject to extensive discussions with all stakeholders. The authorities also placed high importance on ensuring that they clearly communicate the changes to the markets. Reactions of the markets have been positive. Simultaneously, the Polish authorities continued efforts to strengthen the fiscal framework. A new stabilizing perman ent fiscal rule has been adopted. It covers about 90 percent of the general government sector and sets a limit on the growth of expenditures in order to reduce and stabilize the deficit and consequently the public debt. Importantly, by taking into account business cycle developments, it will help avoid the risk of fiscal procyclicality. In addition, taking into account the 7 percentage point reduction of the d ebt - to - GDP ratio resulting from the changes in the pension system, two new lower p ublic debt thresh olds are to be introduced, replacing the previous one of 50 percent. 3 Financial Sector The Polish financial sector remains stable and resilient. Banks are well capitalized, liquid and profitable. The capital adequacy ratio in the banking sector reached 15.6 percent at the end of Q3 2013. Nevertheless, given the high share of foreign ownership and the level of parent funding, any structural changes to funding models of euro area banks might have negative implications for credit supply in Poland and, conse quently, economic growth. The Polish financial sector plays an important role in the CEE region. Given Poland’s relatively deep and liquid financial markets, investors often use the zloty as a proxy for exposure to, or hedge against, risks in the region. Its significance has been recently confirmed by the inclusion in the Fund’s list of systemically important financial centers. Meanwhile, the government - sponsored “De Minimis” initiative launched in March 2013 and aimed at mitigating credit constraints for SMEs proved to be a success. So far, 31,000 SMEs have benefitted from the program, and they were altogether granted with credit of more than PLN 10 billion (around USD 3.3 billion). This was supported by almost PLN 6 billion (around USD 2 billion) of gove rnment guarantees. The scope of the guarantees has recently been widened to cover also long - term credits. Structural Reforms The authorities continue with the implementation of the structural reform agenda. In particular, their focus on further improving the business environment and limiting red tape has borne fruits, which is reflected in the World Bank’s Doing Business reports. Poland has achieved a remarkable improvement of 29 places over the last two years