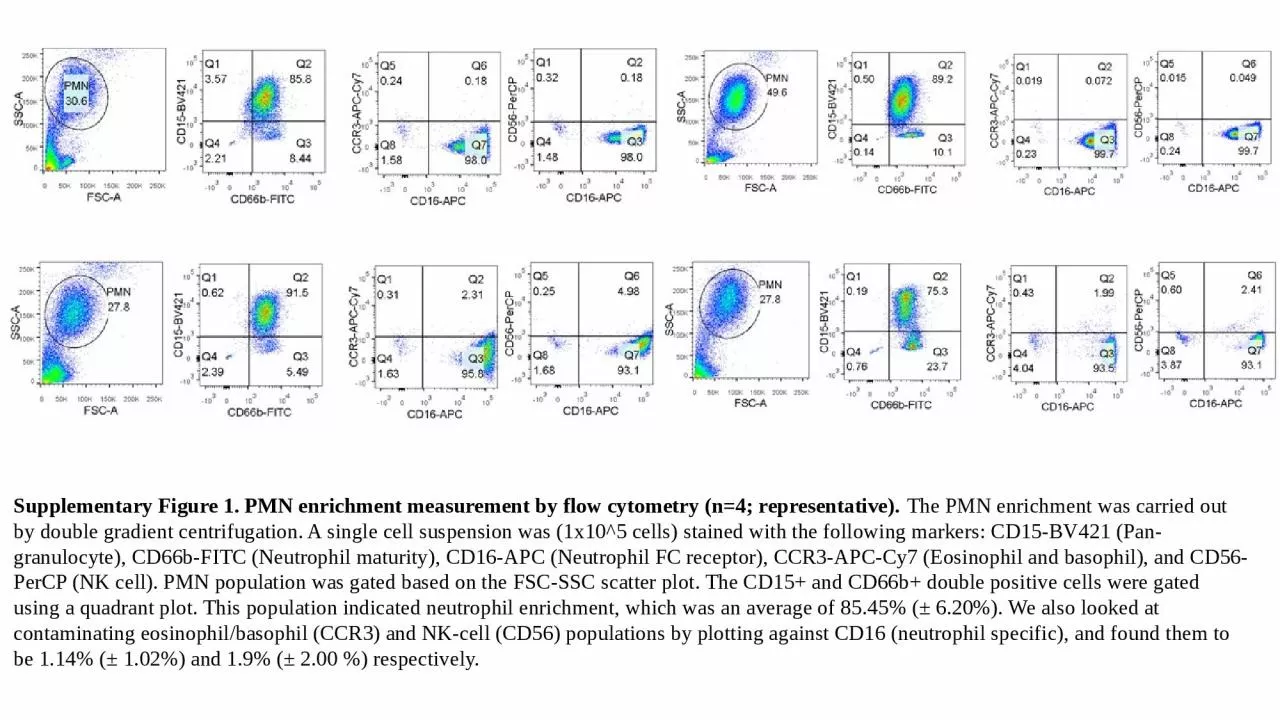
PPT-Supplementary Figure 1. PMN enrichment measurement by flow cytometry (n=4; representative).
Author : julia | Published Date : 2024-01-13
The PMN enrichment was carried out by double gradient centrifugation A single cell suspension was 1x10⁵ cells stained with the following markers CD15BV421 Pangranulocyte
Presentation Embed Code
Download Presentation
Download Presentation The PPT/PDF document "Supplementary Figure 1. PMN enrichment m..." is the property of its rightful owner. Permission is granted to download and print the materials on this website for personal, non-commercial use only, and to display it on your personal computer provided you do not modify the materials and that you retain all copyright notices contained in the materials. By downloading content from our website, you accept the terms of this agreement.
Supplementary Figure 1. PMN enrichment measurement by flow cytometry (n=4; representative).: Transcript
Download Rules Of Document
"Supplementary Figure 1. PMN enrichment measurement by flow cytometry (n=4; representative)."The content belongs to its owner. You may download and print it for personal use, without modification, and keep all copyright notices. By downloading, you agree to these terms.
Related Documents