/
tool for source characterization tool for source characterization

tool for source characterization - PDF document

kaptainpositive
kaptainpositive . @kaptainpositive
Follow
349 views
Uploaded On 2020-11-20

tool for source characterization - PPT Presentation

T2 P1 
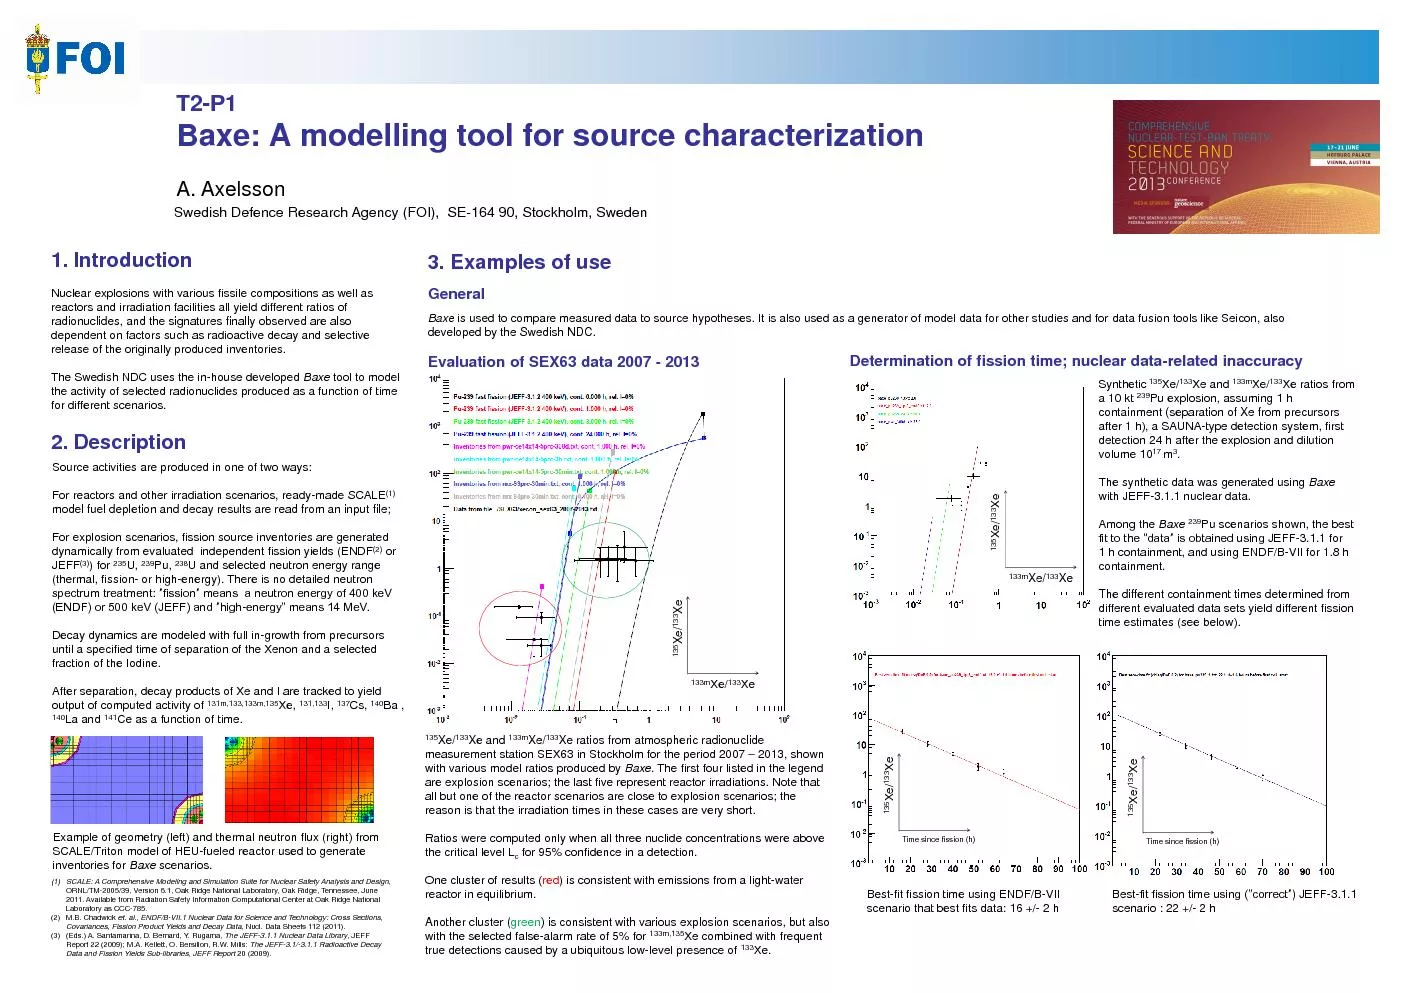
Baxe A modelling 2 Description A Axelsson Swedish Defence Research Agency FOI SE 164 90 Stockholm Sweden Nuclear explosions with various fissile compositions as well as react ID: 820549

data 133 jeff fission 133 data fission jeff scenarios time 135 baxe nuclear 133m explosion decay ratios produced containment

Share:

Link:

Embed:

Download Presentation from below link

Download Pdf The PPT/PDF document "tool for source characterization" is the property of its rightful owner. Permission is granted to download and print the materials on this web site for personal, non-commercial use only, and to display it on your personal computer provided you do not modify the materials and that you retain all copyright notices contained in the materials. By downloading content from our website, you accept the terms of this agreement.


Presentation Transcript

T2-P1 Baxe: A modelling tool for
T2-P1 Baxe: A modelling tool for source characterization 2. Description A. Axelsson Swedish Defence Research Agency (FOI), SE-164 90, Stockholm, Sweden Nuclear explosions with various fissile compositions as well as reactors and irradiation facilities all yield different ratios of radionuclides, and the signatures finally observed are also dependent on factors such as radioactive decay and selective release of the originally produced inventories. The Swedish NDC uses the in-house developed Baxe tool to model the activity of selected radionuclides produced as a function of time for different scenarios. 1. Introduction 3. Examples of use Baxe data fusion tools like Seicon, also developed by the Swedish NDC. Source activities are produced in one of two ways: For reactors and other irradiation scenarios, ready-made SCALE(1) model fuel depletion and decay results are read from an input file; For explosion scenarios, fission source inventories are generated dynamically from evaluated independent fission yields (ENDF(2) or JEFF(3)) for 235U, 239Pu, 238U and selected neutron energy range (thermal, fission- or high-energy). There is no detailed neutron spectrum treatment: ”fission” means a neutron energy of 400 keV (ENDF) or 500 keV (JEFF) and ”high-energy” means 14 MeV. Decay dynamics are modeled with full in-growth from precursors until a specified time of separation of the Xenon and a selected fraction of the Iodine. After separation, decay products of Xe and I are tracked to yield output of computed activity of 131m,133,133m,135Xe, 131,133I, 137Cs, 140Ba , 140La and 141Ce as a function of time. General Evaluation of SEX63 data 2007 - 2013 135Xe/133Xe and 133mXe/133Xe ratios from atmospheric radionuclide measurement station SEX63 in Stockholm for the period 2007 – 2013, shown with various model ratios produced by Baxe. The first four listed in the legend are explosion scenarios; the last five represent reactor irradiations. Note that all but one of the reactor scenarios are close to explosion scenarios; the reason is that the irradiation times in these cases are very short. Ratios were computed only when all three nuclide concentrations were above the critical level Lc for 95% confidence in a detection. One cluster of results (red) is consistent with emissions from a light-water reactor in equilibrium. Another cluster (green) is consistent with various explosion scenarios, but also with the selected false-alarm rate of 5% for 133m,135Xe combined with frequent true detections caused by a ubiquitous low-level presence of 133Xe. Determination of fission time; nuclear data-related inaccuracy Synthetic 135Xe/133Xe and 133mXe/133Xe ratios from a 10 kt 239Pu explosion, assuming 1 h containment (separation of Xe from precursors after 1 h), a SAUNA-type detection system, first detection 24 h after the explosion and dilution volume 1017 m3. The synthetic data was generated using Baxe with JEFF-3.1.1 nuclear data. Among the Baxe 239Pu scenarios shown, the best fit to the ”data” is obtained using JEFF-3.1.1 for 1 h containment, and using ENDF/B-VII for 1.8 h containment. The different containment times determined from different evaluated data sets yield different fission time estimates (see below). (1)SCALE: A Comprehensive Modeling and Simulation Suite for Nuclear Safety Analysis and Design, ORNL/TM-2005/39, Version 6.1, Oak Ridge National Laboratory, Oak Ridge, Tennessee, June 2011. Available from Radiation Safety Information Computational Center at Oak Ridge National Laboratory as CCC-785. (2)M.B. Chadwick et. al., ENDF/B-VII.1 Nuclear Data for Science and Technology: Cross Sections, Covariances, Fission Product Yields and Decay Data, Nucl. Data Sheets 112 (2011). (3)(Eds.) A. Santamarina, D. Bernard, Y. Rugama, The JEFF-3.1.1 Nuclear Data Library, JEFF Report 22 (2009); M.A. Kellett, O. Bersillon, R.W. Mills: The JEFF-3.1/-3.1.1 Radioactive Decay Data and Fission Yields Sub-libraries, JEFF Report 20 (2009). Example of geometry (left) and thermal neutron flux (right) from SCALE/Triton model of HEU-fueled reactor used to generate inventories for Baxe scenarios. 135Xe/133Xe 133mXe/133Xe 135Xe/133Xe 133mXe/133Xe Best--VII scenario that best fits data: 16 +/- 2 h 135Xe/133Xe Time since fission (h) Best-fit fission time using (”correct”) JEFF-3.1.1 scenario : 22 +/- 2 h 135Xe/133Xe Time since fission (h)